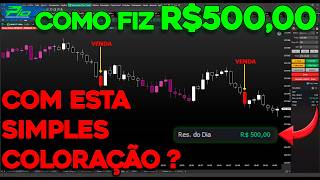

Trading a Real Account with 10 Contracts – Live
60sReal-money trading with high stakes creates excitement and authenticity.
▶ Play Clip"Delivers a live real-account test with clear strategy explanation, but includes promotional segments and some repetition."
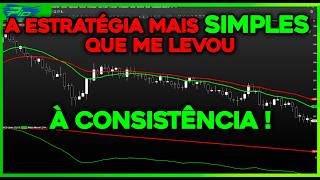
This video presents a live, real-account test of a day trading strategy for the Brazilian mini-index (WIN) called 'Scalp PIO V2'. The trader explains the strategy's setup, logic, and step-by-step execution while the chart runs, demonstrating two winning trades that hit the daily positive target of R$500. The video also covers risk management, backtesting results, and important observations such as prohibited hours and payroll days.
The trader starts the video on July 10, 2025, at 8:57 AM, with the mini-index opening at 9 AM. He is testing the strategy on a real account with 10 mini contracts, emphasizing that the number of contracts depends on individual capital.
The market opened at 9:10 AM. The trader explains the strategy while the chart scrolls. He notes that purple candles mark prohibited times when no trades should be opened.
The strategy uses a 1-minute timeframe. Indicators include: Pivot Point (with lines colored gray), Leandro Stormer method at 55% level, ATR Stop with D1 deviation, 20 periods, arithmetic type, and the P Trader coloring algorithm version 2.0.
To insert the P Trader coloring, right-click on the chart, select 'Insert coloring rule', search for 'P Trader algorithm', insert it, and click OK. Then right-click on any candle, go to properties, change version from 1 to 2, and click OK.
The first step is to wait for a candle to close red below all pivot point lines, or a candle to close blue above all pivot point lines. Until then, the trader stays out of the market.
On July 10, the price remained sideways between the pivot point lines, so no trade was executed. The trader waited until 1:45 PM and then closed the chart, demonstrating discipline.
On July 11, a red candle closed below all pivot point lines. The trader placed a sell order at the red ATR stop. The trade hit the target of R$250, with a stop loss of R$600. The risk-reward is negative but the success rate compensates.
The first trade was a success, earning R$250. The trader explains the logic: price below all pivot lines indicates a downtrend, and the red candle confirms a sell signal.
A second sell signal appeared, and the trade also hit the target, bringing the daily total to R$500. The trader emphasizes executing the strategy to the letter, not deviating from the plan.
Two trades were executed: first lasted 8 minutes, second 1 minute, total profit R$500. The trader considers the real-account test a complete success.
The trader recaps the settings: mini-index, 1-minute timeframe, Pivot Point indicator, ATR Stop (deviation 1, period 20, arithmetic), and P Trader coloring version 2. He shows how to configure each indicator.
Target is 125 points (25 ticks), stop is 300 points (60 ticks). Daily positive target is two consecutive wins; daily loss limit is one stop loss. Monthly positive target of 1000 points and monthly loss limit of 1000 points are recommended.
Pivot Point filters trend: price above all lines = uptrend, below = downtrend, between = sideways. P Trader coloring gives entry signals: red candles = sell, blue = buy, purple = prohibited. ATR Stop provides entry points (green = buy, red = sell).
Step 1: Wait for a candle to close red below all pivot lines or blue above all pivot lines. Step 2: Place a buy order at the green ATR stop (if above all lines) or a sell order at the red ATR stop (if below all lines). The order must be placed above/below the stop, not touching it.
Observation 1: Only trade from 9 AM to 1:45 PM; after that, success rate drops. Observation 2: If a purple candle appears before your order is triggered, cancel the order and wait for a new signal.
If the ATR stop is between the pivot point lines (not above/below all lines), do not take the trade. Wait for a new signal.
On payroll days (first Friday of each month), stay out of the market due to high volatility. The strategy does not work well on those days.
Backtest results: July 1 no signal, July 2 two wins, July 3 payroll (no trade), July 4 no signal, July 7 two wins, July 8 two wins, July 9 one stop loss (but other signals would have been wins), July 10 no signal, July 11 two wins. Total: 9 trades, 8 wins, 1 loss.
The trader promotes a free training course on the Pilsar 10 strategy (price action with parabolic SAR) in partnership with Touro Investimentos. He also mentions an analysis group where statistics and an e-book are available.
The Scalp PIO V2 strategy proved effective in a real-account test, achieving the daily positive target with two quick wins. The key to success is strict adherence to the strategy's rules, including risk management and avoiding prohibited times, which the trader demonstrated throughout the video.
What are the two conditions for a signal candle in the Scalp PIO V2 strategy?
A candle closes red below all pivot point lines, or a candle closes blue above all pivot point lines.
03:42
What is the risk-reward ratio in this strategy?
Target is 125 points (25 ticks) and stop is 300 points (60 ticks), giving a negative risk-reward ratio.
17:25
What is the daily positive target and daily loss limit?
Daily positive target is two consecutive wins; daily loss limit is one stop loss.
17:41
What does a purple candle indicate in the P Trader coloring?
Purple candles mark prohibited times when no trades should be opened.
20:38
What is the time limit for trading in this strategy?
Only trade from 9 AM to 1:45 PM; after that, the success rate drops considerably.
30:23
What should you do if a purple candle appears before your order is triggered?
Cancel your order and wait for the purple candles to end, then repeat the step-by-step process.
31:07
What is the function of the Pivot Point indicator in this strategy?
It filters and determines the trend: price above all lines = uptrend, below = downtrend, between = sideways.
18:48
What is the function of the ATR Stop indicator?
It provides entry points: green ATR stop acts as support for buy entries, red ATR stop acts as resistance for sell entries.
20:51
Why should you avoid trading on payroll days?
Payroll days typically have high volatility, and the strategy does not work well on those days.
34:05
What were the backtesting results for July 1-11, 2025?
Nine trades: eight wins and one stop loss.
40:02
Trader's mindset
Emphasizes that a day trader's job is to execute the strategy to the letter, not to make money, which is a key principle for discipline.
08:54Daily goal achieved
Demonstrates the strategy's effectiveness with two quick wins totaling R$500 in a real account.
12:28Pivot Point as trend filter
Explains a simple, objective way to determine market trend using pivot point lines.
18:48Time limit observation
Highlights a practical rule to avoid low-probability trades after 1:45 PM.
30:23Backtest statistics
Provides concrete data: 8 wins out of 9 trades, supporting the strategy's high success rate.
40:02[00:01] tested this strategy through manual backtesting, I've tested it in a simulator, and today is the day for a real account, and I'm going to show you everything live now with the chart running. As you can see, today is July 10, 2025, it's 8:57 AM,
[00:16] the mini-index opens at 9 AM, and this is the final testing phase of this strategy, which is operating it in a real account. You can see I'm here, man, on my Tour Investimentos account. I'm going to test this strategy with 10 mini contracts.
[00:31] just to test a strategy, but this depends on each person's capital, okay? The asset a minute left. I'll be back with you when the market opens.
[00:45] Okay, man, the market's open. Mines took a long time to open today, didn't it? It was 9:10 in the morning when he opened it. The idea for today's video, guys, is to explain how this strategy works while the chart is scrolling, OK? in real time. If
[00:58] you enjoyed this new video format, where I explain the strategy with the and subscribe to this channel with notifications enabled. As you can see, man, the candles are purple. The purple candles mark the times when we're off-limits. So,
[01:12] while we're in the restricted hours, I'll quickly show you the mini index on a 1- minute timeframe. And today we are using the pivot point. I colored all the pivot bridge lines gray, line
[01:26] one, line two, and the pivot line itself in gray. And here in the levels tab, I've set the Leandro Stormer method to the 55% level. And we're also using, man, the ETR Stop with D1 deviation, 20 periods, and the
[01:39] arithmetic type. Finally, in this strategy, we used the P Trader coloring algorithm in version 2.0. To insert the P Trader algorithm coloring , all you need to do is right-click on the
[01:52] chart and select "Insert coloring rule". You will search for P trader algorithm. Insert it, add it to your chart, click OK, and the coloring in version one will appear for you. This is the first version of the
[02:05] P Trader algorithm coloring rule. But in this strategy, we use version right-click on any candle, then go to P Trader algorithm properties and change it here, look, from version one to version two and click
[02:19] OK. Ready. Version two, dear, is more commonly used to generate If you don't already have my coloring rule, don't worry. All you need to do is come up with strategies. Next,
[02:34] strategy store. Here you should search for PIO PO. You will find coloring algorithm P trad Trader. You can click on this blue button. This tab will open for you, dude. And here in this tab you'll see that we already have 926
[02:48] clients. We appreciate your trust . You will also find an explanatory video of the Piltr Trader coloring algorithm. And obviously, you 'll be able to choose the plan that best suits your needs. Next, you click on "
[03:01] coloring tool, you right-click on the chart, go to insert coloring rule, search for pio p and insert the P trader algorithm coloring, then click OK. And the coloring will come out like this , okay? This image represents the
[03:16] Pil Trader algorithm coloring in its original version, however in this strategy we use version 2.0. Then you right-click on any candle, go to P Trader algorithm properties and change it here. Look, version D1 for
[03:29] two. Don't change the period, okay? Click OK and you're done, dude. Here is the coloring algorithm for P Trader version 2. So these are the settings we will be using in today's strategy. The first step in this
[03:42] strategy, my friend, is to wait for a candle to close red, lowering all the lines here at the pivot point, or for a candle to close blue above all the lines at the pivot point. So, dude, until one of those two things happens,
[03:56] well, I'm going to grab a coffee and watch a series. When one of these two things happens, a blue candle closes above all the lines, or a red candle closes below all the lines, I'll come back here to make
[04:09] my life easier. Also, I'm going to put a horizontal line here, look, up here, on the last line of the pivot point, I'm going to put an alarm, look, alarm active. I'm going to put a horizontal line here too, look, on the
[04:21] last line at the bottom of the pivot point, I'm also going to put an alarm. And then, when the price hits one of those two extremes, it will sound an alarm for me. And then I'll come back here to the chart, okay? Meanwhile, I'll have a coffee and
[04:34] watch a series. Hey guys. It 's currently at 13.50, and unfortunately, the price didn't have enough momentum to break through all the pivot point lines, either upwards or downwards. Today the price remained sideways throughout this period.
[04:49] This means that we will not be implementing this strategy today, okay? Today is Thursday, July 10th. I'll only come back on the next trading day, July 11th, to wait for a signal so we can test this strategy in a real account,
[05:02] okay? Hey guys, it's 8:59 AM. It is now Friday, July 11th. Let's see if this strategy works for us today, okay? As I told you, I've already tested this strategy through backtesting, and also through the
[05:16] simulator. And now the final phase is to test this strategy in a real account. The market has already opened, and as I told you in yesterday's trading session, we need a candle to close red below all the pivot point lines, or
[05:30] a candle to close blue above. of all the lines from the pivot point. Unless either of those two things happens, man, there's nothing I can do. can see that the candles here, look, they're purple, and these candles mark the
[05:45] forbidden time for us, right? So, let's wait for these purple candles to end and let's hope that this time, right, we have some entry signal, because in yesterday's trading session we didn't have any, look, in yesterday's trading session the price stayed the
[05:57] whole time between the extremes here at the pivot point, as you can see. Just to remind you again, I'm testing this strategy with 10 mini contracts. I know it might seem like a lot of contracts, but it will depend on
[06:09] the capital you've set aside to test your strategy. In my case, I set aside enough capital to test it with 10 mini contracts, OK? here, look, a horizontal line at the top of the pivot point. I'm going to
[06:22] set an alarm here, okay? And I'm also going to put a horizontal line at the bottom here, look, at the pivot point. I'll also set an alarm. If the price hits either of those two extremes, it will set off alarm bells for
[06:35] me. Meanwhile, I'm going to grab a coffee and watch a series. you can see, it went past that region, the lower part of the pivot bridge,
[06:51] right? Down here from the pivot point. I ended up deleting the pivot bridge.
[07:05] we had a candle that closed red below here, look, from all the pivot point lines, okay? So, first step completed. The second step is to place a sell order at the red stop loss, if it is below all the
[07:17] pivot point lines, which is the case here. Okay folks, this trade only ends at the stop loss or at the ALFO (alternate value). If it hits the stop loss, I lose R$600. If it hits the target, I make R$250 on this trade, okay? With a daily positive goal of two consecutive wins,
[07:30] man, if I have a daily positive goal in this trading session, I'll make R$ 500. So, man, you realize that I'm trading with a 300-point stop loss and a 125-point isn't for everyone, man. This is for those who have the stomach for
[07:44] this kind of surgery. If you don't have the stomach for operating with that kind of risk-reward ratio, that strategy, okay? And dude, even though this is a setup, what am believe the price is making this kind of movement, look. It's showing
[07:58] a leg of a downtrend. He did a pullback here. Since we had this candle that closed in the red and then the price encountered resistance here, believe the price will make this downward move, okay? So,
[08:12] even though this is a setup, there's a basis for it, man, in price I believe the price will do. And I repeat, now that I've opened the operation, can do, there's no middle ground. Either I
[08:25] end at the stop loss and lose R$ 600, or I end at the target and gain R$ 250 end at the target and gain R$ 250 on this trade. No half measures, requires a lot of emotional control. How many people, seeing the price
[08:40] approaching this point, look, so close to the target, how many people wouldn't have already you've been doing this for many years, you know, a lot of time operating and all that, you stop caring. You begin to understand that your job as a day
[08:54] trader isn't to make money, your job as a day trader is to execute your strategy to the letter. So, if my target is down here, man, at 125 not going to raise my target here just to get out of the operation and have a
[09:08] momentary relief. No, man, the strategy must always be followed to the letter. Beauty? Okay, man, the first operation was a success, as you can see, R$ 250 was raised, right? We are now within a prohibited time, as you can see,
[09:23] the candles are purple. And I repeat, man, the operation we did here, even though we were using a setup, this strategy is based on price action, right? We believe that when the price goes below all
[09:36] believe in a downtrend. So, when the price came here and returned to the red ETR stop and we sold, I believe the price believe in a downward trend
[09:48] , you understand? But besides that basis in price action, man, I have other things that make me believe even more in the trade I just made. First of all , we have a red candle in
[10:01] that red candle is showing us a sell signal. So, just that to sell. Statistically speaking. The other reason, as I said, is that the price is completely below, look, all the Pivot Point lines. So,
[10:16] when that happened, I started to believe, statistically speaking, that falling than to start rising. And besides that, the price hit the consider resistance within this strategy , you understand? And dude, it's easy to
[10:30] understand this pivot point thing because look, let's remove the top for a more clearly. Wow, notice that the price, during all this time here, around, it was sideways while it was between the extremes of the
[10:44] it went down here, look, from the pivot point, you realize it gained more momentum. And you can see that in previous auctions as well. Look, when the price went below all the pivot lines in this trading session on July 9th,
[10:57] in the downtrend. When he was between the lines here, look, at the pivot point, on that day, July 8th, look how he was banging his head against the wall, walking sideways. Now, on July 7th, it collapsed . Look at the strength he gained. That's why
[11:10] here, because I believe the price is now trending downwards, OK? So I'm back now with stoptr. As soon as the off-peak hours are over, and we get another signal, I'll come back here with you guys. Alright,
[11:23] man? It looks like this candle here will close red as well, if that's the case. Sell order placed, huh? Okay, sell order placed. Notice, man, that it's always below here, look at the red stopper. Not necessarily
[11:35] a tick that's below the red stopper, but below the red stopper it can't be like this, touching the red stopper, it can't be above it either, look, no, it needs to be in front of the red stopper, okay?
[11:48] And of course, man, as the stop-loss moves, I'll stop-loss moves, I'll move my sell order accordingly.
[12:00] now finished. Okay? There's nothing I can do. Or this operation ends here at the stop, OK? From R$600, or it ends here at the target of R$250, okay? If you come here for 250, I'll make R$ 500 today. And if it comes here at the R$600 stop, since I've already
[12:13] made R$250, I'll lose around R$ 350, okay? Anyway, done, man. Everything I could do, I've already done, okay? There's nothing more I I've already done, okay? There's nothing more I can do right now, okay? Beauty?
[12:28] Okay, man. So, positive goal achieved, we made R$ 500 in today's trading session. You can see that this operation was quite simple , right? These operations that we carried out were also very quick operations . So, dude, look what
[12:41] movement, look, a consider, right? The price went back up, we sold at the red ETR stop, right? The price dropped again, we sold again at Sop Terra Vermelho.
[12:55] So, man, I repeat, there's a very strong technical basis to it, man. The main thing is this one here. We had one candle that closed red using the Pill Trader algorithm in version 2. We also had another candle that closed red using the P Trader algorithm
[13:07] in version 2, understand? And then when we saw those two candles closing look at this point, okay? No red stopper. And we sell them here too, look, as you could see, we hit our positive target, we achieved our positive goal in
[13:22] this trading session. And I wanted to show this to you guys, not just so we could test this strategy together, because this is the final testing phase of this strategy. Not only that, I wanted to show you how a
[13:34] professional trader should behave, even when testing a could see here on July 10th, I arrived at the market and waited for signals until 1:45 AM, man. I arrived here
[13:46] at the start of trading and stayed until 1:45 PM until this candle was seen. And I didn't get any amateur trader, I would come here, look, and click " buy market" or "sell market," even without having an entry signal. When it was 1:45 PM, I simply closed the
[14:01] chart and went back to today's trading session. Did you understand? That's the attitude a signal, it doesn't work. When given a signal, execute the signal without thinking. Beauty? That's what we did here. Now let's take a look at the
[14:16] the real Touro account. And these were the operations we carried out today. Just two transactions, R$ 500. The first transaction lasted 8 minutes, the second transaction lasted 1 minute. So, man, this test we
[14:30] did on a real account with this strategy was a complete success, okay? I hope you enjoyed this new way of explaining strategies with the scrolling chart showing strategy tests in a real account, okay? Cool, man.
[14:47] closed. These were the two operations we had today, which I showed you. Further ahead we had, look, another sell signal right here. We had a red candle here below all the pivot
[15:01] had a signal executed right here, look, where I'm going to highlight it for you, with this circle. This operation, man, as you can see, it could even be profitable, look, the price would drop out of the operation down here. However, the daily positive goal
[15:14] of this strategy is two consecutive wins. We would not, therefore, carry out this third operation. After that, we received no more signals. Now that you've running on a real account, I'm going to
[15:26] the settings, risk management, the logic behind this strategy, the step-by-step process, and the observations in a more organized way, and we'll do a few quick days of backtesting together, okay? So let's go. Settings,
[15:40] mini index, 1-minute timeframe, man. I'm going to ask you to come up here , look, at the indicators, more indicators. In the search bar, look for pivot. You will insert the pivot bridge indicator into your chart.
[15:52] Finally, just search for ATR. You need to insert an ATR Stop indicator indicators that we will use in conjunction with the P Trader coloring algorithm. So, right-click
[16:06] on the chart, go to insert coloring rule, search for Pi, the P trader algorithm will appear, insert it into the chart, click add, click OK, you will receive the coloring in the original version, which is
[16:19] version one. So you right-click on any candle, go to Pill Trader algorithm properties, change version one to version two, you don't need to change anything here in the period, OK? Click OK.
[16:31] Okay, now you're on version two of the Pill Trader coloring algorithm. Next, dude, double-click the pivot point. On line one, you change it here, look, to cream color. Also in cream color on line two. Come in the
[16:43] pivot appearance. Change this color to cream as well. And now, let's move on to the next level. Click on the Leandro Stormer method. Enter the level 55. Now remove the level 61.8. Also remove the 100% level, then click OK. Finally, double-click the
[16:58] ETR stop button. Change the detour here to one. The period remains at 20. The type remains arithmetic. In terms of appearance, you can increase the thickness of both lines, and on line one, you can change the color here to a more vivid green, okay?
[17:11] Click OK. Click OK again. Okay, man. Our strategy is set . Risk management. Dude, in this strategy we use the risk-negative-return ratio in order to have a high success rate. The target is
[17:25] 125 points, which is 25 ticks here on the mini-index, and the stop is 300 points, which is 60 ticks here on the mini-index. The daily positive target is two consecutive wins, and the daily loss limit is one stop loss. So, if you have two
[17:41] consecutive winning trades in a day, you should stop trading and only return on the next trading day. If you experience a stop-loss order during the day, you should stop trading and only resume on the next trading day. And I repeat, man, the risk-reward ratio is negative, but the
[17:55] success rate of this strategy compensates for that negative risk-reward ratio. You can verify this yourself through your own backtesting. Dude, it's smarter for you to operate this strategy with a monthly positive target
[18:08] of 1000 points and a monthly loss limit of 1000 points. If you don't want to do that, you can operate normally every day, okay? However, if you use the monthly positive target and the monthly loss limit, if you reach
[18:21] 1000 positive points in a month, you should stop trading and return the following month. If you reach -1000 points , you should stop trading that month and return the following month. Okay, man. This is the
[18:34] risk management aspect of this strategy, the logic behind the strategy. OK, man. Let's ignore the stop indicator for a moment . Let's also ignore the P trader algorithm coloring rule for a moment and focus on the pivot point. In this
[18:48] strategy, this indicator serves to filter and determine the trend in a simple and objective way. If the price is above all the pivot point lines, then we're going to believe that the price is more
[19:02] likely to continue rising than to start falling. So, we can see that in this graph. We can also see that in this graph here, look. OK. Price above all lines, upward trend here too,
[19:16] upward trend. And of course, man, in the same way that when the price is below all the lines, as is the case here, look, the price is below all the lines, in this strategy we should believe that the price is
[19:31] more likely to continue falling than to start rising, okay? And it's obvious, right, man, when the price is between the lines, as is the case here, look, the price is between the lines, man, then we're going to believe in a sideways movement. We
[19:45] won't see an upward trend, nor a downward trend. Beauty? Now, for a moment, let's ignore the pivot point indicator and focus on the pill trader algorithm coloring rule . I'll insert the
[19:58] . I'm going to modify this to version two of this coloring. The function of the P Trader algorithm's coloring rule in version 2 is to give us an entry signal and
[20:10] also show us the prohibited times. So, when we have candles that close in red, we're going to believe it's a sell signal, a selling momentum, where the market is more likely to fall
[20:23] than to rise. This is the function of the Pil Trader algorithm's coloring rule in version 2. When we have blue candles, as you can see here, look, blue candles, it means that the price is giving us a buy signal. The
[20:38] market is more likely to rise. We have buying momentum, OK? And when we have purple candles, those are times when we cannot open operations, OK? And finally, in this strategy, we use the
[20:51] ATR Stop indicator. And it is nothing more than an entry point. When the ATR stop turns green, we then have a buy entry point. He provides support for this strategy, OK? Similarly, dude, the red ETR Stop acts as
[21:05] resistance for us, OK? That's the function of the ATR Stop in this strategy. So, putting together the Pivot Point, Stop ETR, and the P Trader algorithm coloring, we have today's strategy. So, dude, the logic behind the strategy is simple.
[21:21] If the price goes below all the Pivot Point lines and we have, look, candles that close in red, like these candles here, it means that we have a better chance of success when we sell, look, at the
[21:35] ETR Stop. And when we have purple candles, as is the case here, look, we stay out, because at those times we have a higher chance of being stopped out. Similarly, if the price goes above all the pivot point lines and we
[21:49] have, look, candles closing in blue, like this candle here, like this candle here, like this other candle here too, we're going to believe that the market is more likely to respect the region that we believe is
[22:02] support, such as the ETR stop, you understand? So, man, that's the logic behind today's strategy. Step by step, man, to keep things more organized, I've broken down this whole strategy, actually, I've organized this whole
[22:16] strategy into a step-by-step process, okay? We're going to use as an example the trading session that begins with this candle right here, look. And the first step is: wait for a candle to close red below all the pivot point lines, or for a candle to
[22:30] close blue above all the pivot point lines. So, dude, the first step is really simple, okay? You only need a blue candle to close above all the pivot point lines, or a red candle to close below
[22:43] all the pivot point lines. So let's just wait and see if that keep waiting. Until that happens, we're not doing anything, we 're staying out of it, okay? We haven't opened any operations yet; we're waiting for that
[22:56] to happen. Here, as you can see, we've completed the first step, since this candle here, look, closed blue above all the completed. Second step, since a candle closed blue above all the
[23:11] Pivot Point lines, we will place a buy order at the green Stop Loss, if it is also above all the Pivot Point lines. Hey, notice that Pivot Point lines. Hey, notice that the green Stop ETR is between the
[23:24] Pivot Point lines. The green stop is not above the pivot point lines, it is place our purchase order here. And you notice that the price touches the ETR stop, but between the lines. So now we need to wait for a new signal,
[23:40] okay? Because the price has returned, look inside the pivot point lines. So, step, which is to wait for a candle to close blue above all the lines or red below all the lines. And this came to pass later on.
[23:53] Look, this candle closed blue above all the pivot point lines. First step completed. The second step is to place the buy order at the green stop-loss if it is above all the pivot point lines. And here, look, the
[24:05] stop was above all the pivot point lines. So, when that candle opens, man, and in this case that candle would open here, look, you should already positioned here, look, on your green PTR. Like this, man. And
[24:17] remember, the buy order needs to be placed above the green stop. The buy order needs to be positioned above the Green Ground Stopet, not necessarily one tick above, but it cannot be
[24:31] touching the green ground, nor can it be below the green ground, okay, Pi? But why? Because all the tests we did with this strategy worked best this way, the order placement, okay? It became more objective this way, and
[24:46] also simpler for our order to be activated. So this is how you in this strategy. In that case, folks, our purchase order would be triggered same candle. So, as I said, our buy order would have been
[25:00] triggered here, pressing down slightly to the side, and when it starts to go up again, we would exit the trade at this point. That would then be the first profit of the day. The price would trigger you realize that this strategy, man, only has two steps, right? The daily positive goal
[25:13] of this strategy is two consecutive wins. We've already had our first win here, man . Let's redo the step-by- step process to go after the second profit of the day. The first step is to wait for a candle to close blue above all the
[25:26] pivot point lines or red below all the pivot point lines. So, things happens. We just keep waiting and waiting. Now we have a candle that closed blue above all the pivot point lines. So we
[25:40] have completed the first step. Second step, since a candle closed blue above all the lines here at the Pivot Point, we will place a buy order at the green Stop Terre. If it's also above all the
[25:53] Pivot Point lines, you can see, man, that the Green Stopetre is above all the Pivot Point lines. So back here we had that candle that pivot point lines. So we would place our buy order
[26:08] above the green stop here, and we would follow the green stop with our buy order until the order was triggered. And in that case, our order would be triggered at that point, man. Right here. Always remember, of course, that the order
[26:21] should be positioned above. The buy order must be positioned above the green stop tag. Not necessarily a tick above the green stop, but above the green stop. OK? So our purchase order would be triggered at that point. I zoomed out on the
[26:35] graph here. As I said, the order would be triggered at this point, and up here trade. That would be their second win of the day. In this auction. We would then have achieved the positive goal of the area reached. Let's look at another example quickly. Let's
[26:49] use as an example, my friend, the trading session that begins with this candle. Well, the first step here is to wait for a candle to close blue above all the pivot point lines, or for a candle to close red below all the
[27:02] pivot lines. Alright, man? So we'll just wait here for one of two things to happen. Beauty? We need a candle to close either blue above all the pivot point lines or red below all the
[27:14] man, you can do whatever you want. You can read a book, you can watch a series, a movie, you can simply put here, look, a horizontal line on the last line above the pivot point, set an alarm,
[27:27] put another horizontal line on the last line here, look, below the pivot point, set an alarm as well, and simply go to sleep. Dude, you expect the price to go above one of those two extremes. And of course, you also
[27:39] wait for a candle to close red below all the pivot point lines or blue above all the pivot point lines. In this case, as you can see, we had a candle here that closed red below
[27:51] all the pivot point lines. First step completed. The second step is, since a candle closed red below all the pivot point lines, we will place a sell order on the red stop-loss, if it is also
[28:04] So, dude, it's clear that the red Stopet is below all the can place our sell order on the red surface. And pay attention to one thing, man. When you place your sell order at the
[28:19] red stop, you must place the sell order below the red stop, never above the red stop, and never directly on the red stop. It needs to be below, not necessarily one tick below, but it
[28:33] needs to be below the red stop sign, okay? And of course, man, as the red stop moves, you move your sell order along with the red stop. Look. It keeps moving, it keeps
[28:46] moving until the order is triggered. And in that case, the sell order would be triggered right here, look closely, OK? And down here, the price would trigger exit from the operation. So that would be the first gain of the day, the price would hit
[28:59] the target right down here. However, the daily positive goal of this strategy is first win here, man. Now let's go after the second win. And for first step is to wait for a candle to close blue above all the
[29:14] pivot point lines or red below all the pivot point lines. So we happen, and you can already tell that it happened here. Dude, we had a candle that closed red below
[29:27] candle is right here. First step completed. The second step is, since a candle closed red below all the pivot point lines, we will place a sell order at the red stop-loss, if it is also below all the
[29:41] pivot point lines. Hey, look, the Stopet is red below all the place our sell order at the our sell order must be placed below the red stop-loss.
[29:54] Not necessarily a tick, but below the red stop, okay? So here, our sell order would already be triggered, and the price below would already show the gain of the day, a positive target achieved in this trading session. Okay, man. This is a
[30:08] simple, objective, and clear step-by-step guide to this strategy. Observations. Dude, I have four observations for you regarding this strategy. Let's go. The first thing to note is the time limit. Look, let's say you arrived at the chart right at the
[30:23] market opening and you were waiting for a waiting, waiting, waiting. But then this time came, look, 1:45 in the afternoon, this time here. If it gets to 1:45 PM and you haven't received an
[30:38] entry signal, man, you're going to close the chart and come back on the next trading day. This happened to me at the beginning of this class and I showed it to you, okay? that time onwards, we've noticed in backtests that the success rate of this
[30:52] strategy drops considerably. So, we search for operations from 9 AM until 1:45 AM at the latest. After that time, we no longer search for observation: prohibited hours. Dude, let's say you had an
[31:07] here. Look at this buy signal here. And then you placed your buy order at the green ETR stop. However, before your buy order is triggered, some candle has already opened in purple, as is the case here. When that happens, my
[31:21] friend, you should cancel your purchase order. You'll wait until the purple candles burn out and then repeat the step-by- step process, okay? In this case, folks, we then had another blue candle above all the lines, and that gave us
[31:35] buy here, for example, in this green topcoat, which, by the way, this operation here would also be a winning operation. Take, for example, this other situation. In this trading session, man, we had a candle
[31:49] place your sell order at the red stop-loss. However, notice that we had here, look, a candle that already turned purple. So you'll have to wait until this sequence of purple candles at forbidden times is over, right?
[32:02] Then you wait for another candle to close red below all the lines or blue above all the lines. In this case, the candle closed red below ahead, look here, your sell order would be triggered, right? And that would even be a
[32:17] gain, right? A sell order triggered here, and down here we would have a profit. Let's now move on to the third observation, which is to stop the TR between the pivot point lines. Dude, let's say you're in this situation here. Look, a candle closed
[32:31] blue above all the Pivot Point lines, but the price, man, touched the green ETR stop inside the Pivot Point lines. Look, the green Stop ETR was not above the Pivot Point lines. That means you wouldn't do that
[32:44] operation, of course, right? And you would need to wait for a new signal, OK? So, for example, here you had another candle that closed blue above all the pivot point lines. Look, and then you would buy it here at Stopetre Verde. In this
[32:57] case, our buy order would be triggered at this point, and exit of the trade. Look at this other situation, for example, man. Look, right here. You had a candle that closed red below all the
[33:10] pivot point lines. Look, however, the price touched the Red Stopetre within the pivot point lines. When that happens, man, like it also happened here, look, the candle closed red below all the pivot point lines, but the price
[33:23] touched the red ETR stop between the pivot point lines. When that happens, man, you should wait for a new signal, whether it's a buy ahead, there was a "sell" sign, right? This candle closed red below all
[33:37] , the lines were up here, look, two up here and one all the lines, this red candle and the red touch price also below sell. So in this case, our sell order would be executed at this point, and
[33:53] down here, look, the price would catch up to exit the trade, so there would also be a profit in this situation. Fourth and final point, man, is the payroll. On point, man, is the payroll. On payroll days, which typically occur on the
[34:05] first Friday of each month, we should stay out of the market. We can't operate on paydays, okay? Because on those days we typically experience high volatility. I did n't see that strategy working very
[34:19] well on payday, so we stayed out of it . It's just one day a month, man, that okay? Okay, man. These are the observations regarding today's strategy. Quick backtests. OK, man. Let's do the
[34:32] backtesting for the month of July, from July 1st to July 11th, okay? July 1st, which began right here, look, with this first candle. And in this trading session, we did
[34:44] , okay? Because the price remained between the extremes of the pivot point lines throughout the entire trading session. He went neither below nor above. In other words, we considered the market to be trading sideways throughout this entire trading session, okay? We would be left out.
[35:00] was different, right? July 2nd began right here at this spot. We then had a candle that closed red below all the pivot point lines, as you can see. So, because of that, we could execute
[35:14] red stop. The sell order look, the price would catch on and exit the trade. Man, that would be the first profit of the day. And then we had another candle that closed red below
[35:27] we could sell it here, look, at the red estopet. So, our down here, look, the price would already reflect the exit of the operation, okay? That would be their second win of the day. Positive target achieved in this trading session. Let's take a look now at
[35:40] July 3rd. But, dude, July 3rd, even though it was a Thursday, was payroll day, okay? That happened, man, because Friday, July 4th, is a holiday in the United States, so they moved the payroll data forward
[35:53] to July 3rd, okay? So, exceptionally, in that month of July, the payroll was on July 3rd, a Thursday. And even though we would have a positive area target reached on July 13th, look, we would
[36:06] make a buy operation here, right, which would be a profit, because back here, look, this candle closed blue above all the lines, so we would buy here. There would be a gain in this operation. Here too, look, this candle closed blue, and if
[36:19] we bought, man, right here, look, in the green PTR it would also be a profit, okay, would be triggered here and up here, look, the price would then trigger an exit from the trade, okay? So, it would be a gain, it would be a positive target, we would reach 250 points here, right, in
[36:32] this trading session. However, we couldn't operate here on July 3rd because we have to follow rules, okay, man? It was payday. Let's move on to July 4th. On July 4th we also didn't have any signals because the price stayed
[36:45] between the extremes here at the pivot point, so we weren't going to do anything here. On July 7th, which began with this sail right here, man, the story was different again. We had signs of entry, right? We had a
[36:57] sell signal here, look, since this candle closed red, below all the sell here at the red top. So, this would be a winning trade, right? Since the price would trigger our sell order here on the
[37:10] exit from the trade. So that would be the first profit of the day. Next, we had another candle that closed red right here below all the pivot point lines. So we would sell it here at SPTR Vermelho.
[37:23] triggered at this point, and the price below would trigger the exit from the trade, okay? That would be the second gain of the day, a positive goal achieved here on July 7th, right? And now we'd come to July 8th, which began with this candle right
[37:37] here, look, July 8th, okay? In this candle here. And we would have a sell signal executed right down here in this trading session, okay? Since this candle, look, closed red below all the pivot point lines. So we would sell it
[37:49] sell order would then be executed here and down here; look, the price would already be at the exit point of the operation. The first profit of the day would be expensive, right? Next, we look, it also closed red below all the
[38:03] pivot point lines. So we would sell it here, look, at Sopetre Vermelho again, right, our sell order would be executed at this point and down here, look, the price would already be exiting the trade, it would be the second profit of the day here on
[38:17] July 8th, positive target hit here on July 8th, okay? That would be their second win of the day. Let's now move on to July 9th, which began with this candle. Right here, in the a candle that closed red below all the pivot point lines. We would
[38:31] then sell it here, look, below is only red PTR. However, on that day the Our sell order would be triggered here, and we would be stopped out up here. So, the area loss limit was reached in this trading session. And also, you know, if
[38:44] we look here, this was a huge stroke of bad luck, because if we used the positive monthly goal of 1000 points, look, on July 2nd we had two gains, 250 points. On July 7th, two more gains, 250 points. On
[38:59] July 8th, another 250 points. If we had a positive goal here on July 9th, we would have already surpassed the monthly positive goal of 1000 points, right? And also, man, then here on July 9th, we had other
[39:12] successful signals, right? Look, we had a red candle here, and then we would hit the sell signal here, look, on the red SOPTR, it would be a profit. We had another red candle up ahead, look, all below all the pivot
[39:24] point lines, right? And we would sell it here on the red Stopetr, that would be a profit too. This other red candle that closed below all the Pivot Point lines. We would sell here, look, at the red ETR stop, and this operation would also be profitable. So, all
[39:37] the other signs that we had here on July 9th pointed to a win, only the first sign here, look, which would be a stop, but it happens, right? It's part of the process. And now, man, on July 10th, I showed you with a chart running, we did
[39:50] n't have any signals, since the price didn't go above or below all the Pivot Point lines. And on July 11th, which was the trading session I showed you today, we had
[40:02] operation here which was a victory, we had this other operation here which was also a victory. So, man, from July 1st to July 11th, we had nine trades, of which eight were wins and only one was a stop loss. That's right now
[40:19] , in July 2025, okay? Okay, man. These are the strategy with you. Of course, I've already done several months of backtesting of this strategy here. I have all the
[40:31] statistics for that strategy, at least for the last 6 and 12 months, okay? But anyway, these are the quick backtests of this strategy. Next step. Listen, I have two very important things to tell you. Dude,
[40:44] here on the channel we already have several strategies that use the Pill Trader algorithm coloring. And we have a group that analyzes most of these strategies. These are weekly analyses. So, go to the description of this video,
[40:57] click on this link, you will be directed to this page, click on this button and you will be directed to our analysis group. I'll put the statistics for that strategy there. You 'll also find out which strategies are
[41:11] Strategies that utilize a coloring algorithm, P Trader. I'll also put the e-book for this strategy in that group to make it easier for you to remember how the strategy works, okay? So
[41:25] join in now, man, I have a second very important thing to tell you. Hey, I showed you a setup today, right? But sometimes you just don't like certain setups, and that's perfectly fine, man. Sometimes it's not just about trading
[41:38] setups, you might prefer price action. No problem, man. In the description of this video you will find a free training course that I developed together with the brokerage firm Tour Investimentos, which is the partner brokerage firm of this channel.
[41:51] A training session where I teach the strategy described below. Look, Pilsar strategy 10. This month of July, she hasn't triggered any stop-loss orders yet entirely based on price action. And I'm going to show you now, man, all the
[42:05] signs that the Pilsar 10 strategy gave this July. Notice that in this strategy we used Price Action and the Pilsar 10 strategy found a buy entry point here on July 1st and it was a win. OK. Then,
[42:18] price was coming from an upward trend movement and the Pilsar 10 strategy found that buy entry point right there. The same thing happened on July 4th. Look, the strategy identified this upward trend movement and
[42:33] gave us the entry point right here. And that was a victory too. Notice that the price, On July 7th, the price already reflected this downward trend. We had a sale in this region here, look, and it was a success. July 8th, a
[42:47] sell signal right here. The strategy identified at that point was also a victory, on July 9th as well. And finally, on July 11th, two excellent signs: Look, the price was moving in a
[43:00] downward trend. The strategy identified the sales entry point here. Next, another point of entry for sales here. And both operations were successful. If you operated the Pilsar 10 strategy this July, following the
[43:13] strategy exactly, you did not experience any stop-losses with this strategy. So, guys, in this Pilsar 10 strategy training that I developed in conjunction with the partnership with Tour Investimentos, I'm giving you a
[43:27] strategy with 100% objective price action , no guesswork, okay? I'll show you the statistics for this strategy over the last 18 months. And I repeat, the link to this free training is in the description of this video and
[43:41] also in the first pinned comment. Okay, man. These were the messages I wanted to convey to you. And regarding today's strategy, dude, always remember that if you don't have my P trader algorithm coloring rule, that's
[43:54] okay. All you need to do is come here, look, to the strategies store. In this search bar, you type pio po. And you will find here, look, the P trader algorithm coloring. Click on this
[44:08] blue button and this tab will open for you. You see, man, we already have you. You see, man, we already have 926 customers. We thank all of you who believe in our work. Here's an explanatory video about the
[44:20] P Trader coloring algorithm, okay? And you can also choose the plan that best suits you. Next, you click on "hire". When you use my need to do is right-click on the chart, go to "
[44:34] Insert Color Match Rule," search for " pio p," insert the color matching rule into your chart, click "Add," click " OK," and the color matching will be applied. However, this is the original coloring. In today's strategy, we don't
[44:48] right-click on any candle, go to Pill Trader algorithm properties, change it here, look, the D1 version to two, keep the period at 10, and click OK. Okay, man. This way you have the
[45:01] P Trader algorithm coloring in version 2, exactly the same coloring I used today to test this strategy with 10 mini contracts and make R$ 500, OK? Hey man, if you liked this new video style, where I start the video with the
[45:15] chart already rolling and explain the strategy, trading on a real account, please leave a like so I know if I should bring more videos like this to the channel. And of course, subscribe here with notifications turned on. And
[45:28] I sincerely hope you enjoyed this video and that it has added value to your life as a day trader, because I won't rest until you become a successful trader or achieve your goal. I'll be staying here, man, and see you in the next
[45:40] video. [Applause] find the secret video for the Pilsar 10 strategy training. It's a training program
[45:52] created in partnership with the brokerage firm Touro Investimentos. For those who like price action, you understand? In this five-lesson training, I delve into my favorite indicator, the parabolic SAR. I'll show you how it can be a
[46:05] powerful tool when used in conjunction with Price Action. And just one detail, man, the Pilsar just one detail, man, the Pilsar 10 strategy has had an 89% success rate over the last 18 months. So, if you want to delve deeper into the Pilsar method, where I combine
[46:18] Price Action with the Parabolic indicator for free, the link to the secret video is in the description of this video and also in the first pinned comment.
⚡ Saved you 0h 46m reading this? Transcribe any YouTube video for free — no signup needed.