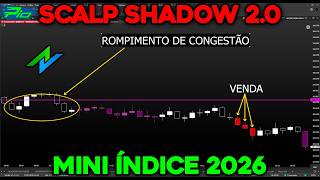

Why Every Trading Strategy Dies
45sStarts with a bold, relatable problem for traders - that all strategies expire - creating curiosity and urgency.
▶ Play Clip"Delivers a genuine strategy update with clear rules and backtest, though heavy promotion of the paid method slightly dilutes the value."
This video presents the Scalp Shadow 2.0 trading strategy, an updated version of the original Scalp Shadow strategy shared in January 2025. The creator explains the update criteria used in the Pilsar 3.0 method, demonstrates how to configure the new setup on a chart, and walks through a backtest showing its performance. The strategy is designed for the 2-minute mini-index and aims to achieve daily and monthly profit targets.
Every strategy has an expiration date and can perform poorly when market conditions change. The creator developed an objective criterion for updating strategies to keep them functioning.
Three scenarios trigger a pause and update: 1) two negative months out of last three, 2) one negative and two positive but weak, 3) all three positive but weak. Always observe the last 3 months.
The strategy chosen for update is the Shadow strategy posted in January 2025. The setup uses Donchian Channel and Pivot indicators.
Place Donchian Channel and Pivot indicators. Configure pivot levels using Leandro Storm method at level 55, remove 61.8 and 100, set colors to purple. For Donchian, remove central average, shift 42 periods. Add P Trader Algorithm coloring.
In the strategy store, search for 'PI PO' to find P Trader Algorithm coloring. Choose a plan, then insert the coloring rule on the chart.
Buy when a blue candle closes touching the top of Donchian channel above all pivot lines; place buy at low with 200-point stop and 100-point target. Sell when a red candle closes touching the bottom below all pivot lines; place sell at high.
Reduce timeframe to 1-minute for more signals. Modify stop loss to 240 points and target to 120 points. Change P Trader algorithm from version 1 to version 3.
Purple candles indicate times not worth trading. The idea remains the same: buy/sell signals based on Donchian and pivot lines.
Daily positive target is two consecutive wins, loss limit within stop-loss area. Monthly positive target is 1080 points, monthly loss limit is -1080 points.
The backtest from November shows consistent wins, achieving daily targets and eventually the monthly positive target of 1080 points by November 11th.
Because the strategy has been updated and backtested successfully, it is now called Scalp Shadow 2.0. A future video will explain it in detail.
If you lack time to create and update strategies, the Pilsar 3.0 method offers ready-made strategies and robots monitored by the team. Link in description.
The Scalp Shadow 2.0 strategy is an updated version with a lower timeframe and adjusted risk-reward, showing strong performance in backtests. The video emphasizes the importance of having objective criteria for updating strategies to adapt to changing markets.
What are the three scenarios that trigger a strategy update in the Pilsar 3.0 method?
1) Two negative months out of last three. 2) One negative and two positive but weak. 3) All three positive but weak.
01:10
What are the original stop loss and target for the Scalp Shadow strategy?
Stop loss: 200 points, target: 100 points.
04:12
What changes were made to create Scalp Shadow 2.0?
Reduced timeframe to 1-minute, increased stop loss to 240 points, target to 120 points, and switched to P Trader algorithm version 3.
05:07
What is the monthly positive target for the backtest?
1080 points.
06:38
What does a purple candle indicate in version 3 of the P Trader algorithm?
Times when it's not worth trading.
05:35
Strategies Have Expiration Dates
Highlights the importance of adapting strategies to changing market conditions.
00:01Objective Update Criteria
Provides a clear, rule-based system for deciding when to update a strategy.
01:10Scalp Shadow 2.0 Modifications
Demonstrates a practical example of updating a strategy with specific parameter changes.
05:07Backtest Parameters
Defines clear profit targets and loss limits for evaluating strategy performance.
06:38Strategy Renamed to 2.0
Shows the outcome of the update process, validating the approach.
11:41[00:01] a strategy from this channel together, and you'll understand exactly how to apply it to your own strategies. And man, this is really important because every strategy in the world has an expiration date. At some point, any
[00:15] strategy in the world can start to perform poorly when the market changes. Realizing this, I needed to find an urgent way to get around this problem. I needed a system to keep my strategies
[00:28] updated and functioning. That's when I developed an objective criterion for updates. So, if any strategy fits those update criteria, I pause it and move on to updating. And that's exactly what
[00:41] I'm going to show you today, man. How does this criterion work, and more importantly, how can you update your own setups? Come with me, man. The information
[00:56] update criteria we use in the Pilsar 3.0 method. We use this, man, for both manual strategies and this criterion or create your own similar criterion.
[01:10] These are scenarios where we would update the strategies. So scenario one is: if the strategy has two negative months out of the last three, we pause the strategy or the robot and we review and update that strategy
[01:24] follows, guys. If, in the last 3 months, the strategy closes one month negative and two months positive, but with a weak score, we pause the strategy, pause this robot, review and
[01:37] update it. And the third scenario, man, looking at the last three months, if all three months close in the positive, but the result is weak, that is, a very small score, again we pause the strategy or
[01:50] pause the robot and update that strategy and update that robot. This is our update criteria table for the Pilsar 3.0 method. You can use you can create your own. So, you see, we always observe the
[02:06] last 3 months of how the strategy works. If, within the last 3 months of the strategy, it fits into one of these three scenarios, we pause and update the robot. OK? Well, now you know how to identify when a
[02:22] strategy needs updating and when it doesn't . But now let's get down to business, shall we ? The strategy I've chosen to update with you all today is the Shadow strategy that I posted here on the channel in January 2025. Let's look at the
[02:35] chart, shall we? This here on your screen is the Scalp Shadow setup. And to configure it, we do it like this. We place the Doncha Channel indicator on the chart, and also insert the pivot indicator on the chart. So,
[02:47] into the chart, and click OK. Now we double-click on the pivot point. We go in levels, click on the Leandro Storm method, put it here, look, level 55, click on include, remove level 61.8, level 100 as well. Now we're
[03:03] color to purple. We're back to appearances. We changed the color of line one to purple as well, and the color of line two to purple as well. We clicked OK. Now we can double-click on the donch channel. We remove the
[03:16] central average. Here are the properties, place a shift of 42 periods. Ready. And to finish, we add the coloring, using the P trader algorithm. And that's it, man. This is the shadow setup traded on the 2- minute mini-index. And
[03:30] traders is very simple, man. All you need to do is follow the strategies section, the strategy store. In this magnifying glass, you search for PI PO and it will appear here for you , look, Pio Trader algorithm coloring . You click on this blue button and
[03:45] here you can choose the plan that best suits you. And realize that we already have, man, more than 1000 clients. We appreciate your trust . After you've selected the coloring plan that best suits you, simply
[03:59] right-click on the chart, select "Insert Coloring Rule," search for "P Trader Algorithm," insert it into the chart, and click OK. Okay, here is the Pill Trader coloring algorithm. And this setup is
[04:12] really simple, man. When a candle closes in blue touching the top of the Donche channel, as is the case here, above all the pivot point lines, we place a buy order at the low of that candle with a 200-point stop and a 100-
[04:25] then, in this case, would be triggered here and up here , look, the price picks up the exit signal buying signal, okay? Now, a sell signal, man. In the following trading session, we sell when a candle closes red touching, look, the
[04:40] lower part of the Donche channel, below all the pivot point lines. So, our order is placed at the high of that red candle. The price, in our sell order and capturing this trade right here. Look, a really
[04:54] quick scalp, okay? This is the original Scalp Shadon that I showed you back in early January 2025, and it continues to perform remarkably well to this day. However, my friend, to further improve the performance of this strategy, we're going to
[05:07] update it. And what did I think of doing? First, let's reduce the time frame of the we would have more entry signals. OK? We are now on the 1-minute timeline. Another thing we're going to do is modify the target and the stop.
[05:21] Let's put a stop loss of 240 points here, and a target of 120 points, OK? right-click on any candle, go to P Trader algorithm properties, change it from version one to version three, and click OK. This
[05:35] is version 3 of the P trader coloring algorithm . Hey man, the idea behind the strategy is going to remain the same, okay? But here's the thing, the purple candles will indicate for us the times when it's not worth trading. And the
[05:47] follows. Look, a " sell" sign right here. When we have a candle that closes red touching the bottom of the doncha channel below all the pivot point lines, we will then place a
[06:00] , the sell order is selected at this point, and the target price for the transaction is shown below. So that's the sell signal, okay? Now, the buy signal, let's look at the trading session prior to this one, works as follows
[06:12] candle that closed in blue touching the top of the Doncha channel, above all the pivot point lines, we will then place a buy order buy order would be triggered here and up here , look, the price would take the exit from the
[06:25] trade and it would also be a win in this trade. So, now that I've made these changes to the Scalp Shadow strategy, I'm going to run a backtest here over the previous months, at least the last six months, and see if
[06:38] its performance is good or not. Remember that the daily positive target is two consecutive wins, the loss limit is within the stop-loss area , the monthly positive target is 1080 points, and the monthly loss limit is -1080 points. Okay, man.
[06:50] strategy. This strategy is performing well. I'll be doing backtesting with you guys here in November to show you the strategy in action. And we'll run backtests until we reach the monthly positive target or the
[07:03] monthly loss limit. Come on, man. Look, here on November 3rd, which is the start of November, right, for us to be operating on the day 3 mini executed here, look, the buy signal. That's because, man, this sail
[07:16] closed blue touching here, look, the top part of the doncha channel. And all of this occurred while the price was above all the pivot point lines. Look at pivot point. A purple line here, another purple line here, another purple line here.
[07:31] The price is above all the purple pivot point lines. And we had a top of the canodon. So, we placed a buy order, look, at the low of that blue candle. Our buy order would be triggered in this region, and the
[07:44] . That would be the first profit of the day. We would score 120 points. The second signal executed, man, still in this trading session, was right here, look, because once again the price is above all the Piv Point lines. This sail closed blue, touching
[07:58] So we buy again at the low point of that candle. Look, our selected buy order is shown here, and the price above would trigger an exit from the trade. That would be their second win of the day. Positive area goal achieved. We will then score 240
[08:10] points. Okay, let's move on to the trading session on November 4th, shall we? So, we've finished day 3, now let's move on to November 4th. We're aiming for a positive monthly goal, right? Look, here on November 4th I realize that we would
[08:23] this candle here. Look, a buy signal. This happens, man, because look, the price is above all the pivot point lines. This candle closed the blue, touching the upper part of the Don channel. So, look, our
[08:36] buy order would be triggered in this region here, look, at the low of this candle. The price price got close to our stop loss, but it would n't stop us out, and when it starts to rise again, we'll be able to exit the trade at this point . So that would be the first profit of the
[08:49] day. Next, I can already see another buying signal right here, man. Again, because the price is above all the Pivot Point lines. This candle closed in the blue, and we would buy then, look, at the low of this candle,
[09:01] buy order, and up here it would exit the trade. That would then be their second win of the day. Positive MetR of area reached. We would have, look, 480 points here in November. Let's move on to November 5th. Here on November 5th,
[09:16] once again, another buy signal executed, right, man . Right here, look. That's because the price was above all the pivot point lines. This on the doncha candle, so we would buy at the
[09:28] purchase order would be triggered in this region up here . Look, the price would be too high to exit profit of the day. And on that trading day, November 5th, we wouldn't have any more executed signals, okay? The price wouldn't have triggered any signals from us. On
[09:43] November 6th, the price remained, look, between the extremes of the Pivot Point lines the entire time. So, because of that, we wouldn't be doing any operations, okay? Now, on November 7th, I realize that I have, man, a sell signal.
[09:55] It was executed right here. Look at this because the price is below all the candle here, look, it closed red, touching the bottom of the our sell order at the high of this candle. The sell order would then be
[10:08] executed in that region, and down here, look, the price would catch on to exit the trade. The first profit of the day would then be expensive . And further on we had another signal executed. The second signal executed today was right here, look.
[10:20] Actually, here, look, at this point. This is again at a price below all other purple lines here are from Pivoponte. This candle closed red touching the bottom of the Donch channel. So we would sell at the high of that candle. Our
[10:34] look, in this region and down here, look, the price would take off the trade, it would be the second gain of the day, positive target achieved, we would now be at 840 points, right? Now, on November 10th, we would n't have any signals. Now, on
[10:48] November 11th, we would have a signal executed strictly following the strategy within the permitted time. Right here. That's because the price is above all the blue touching the black part of the donch channel; we buy at the candle's low.
[11:02] triggered at that point. And up here, look, the price would be right to exit the operation. That would be the first profit of the day. And the second signal executed would be at the low, man, of this blue candle right here. Look, again, the price is above
[11:15] all the pivot point lines. This sail closed blue, touching the we would place a buy order at the low of that candle. Our buy order , look, the price would already be at the exit of the operation. That would be the second gain of the
[11:29] day, a positive target met, and it would also be a positive monthly target in November, okay? If you backtest this strategy from previous months, you'll see that it's been performing well. So we can call this strategy
[11:41] Scalp Shadow 2.0, because it has just been updated, okay? In the future, I will release a specific video showing in detail how this explained. But anyway, if you have any questions about how
[11:55] this strategy works, just comment below. Dude, I understand that not everyone has the time to create strategies from scratch, develop robots, monitor results monthly, and
[12:08] update strategies, and that's perfectly fine . And if that's your case, right? If you don't have time to update your strategies or create them from scratch, come with me to the Pilsar 3.0 method, because there,
[12:21] my team and I monitor and update all the strategies and robots that I use in my day-to-day work. And you have access to all of this ready-made, you understand? There's a link in the description of this video; click on it and you'll be directed
[12:34] straight to the PSAR 3.0 method. If the spots are closed when you click, no worries, you can join the waiting list and secure your spot in the next class. And before you go, if you enjoyed this
[12:47] subscribe to this channel with notifications activated, because I won't rest until successful trader. I'm staying here, man, and see you in the next video. the next video. [music]
![The Moving Average That Anticipates Reversals (Forget the EMA) 🔓💰 [FREE]](https://img.youtube.com/vi/Hds7IuhwzFY/mqdefault.jpg)
![The Only Order Blocks Indicator You'll Ever Need [FREE]](https://img.youtube.com/vi/q10Cimko20g/mqdefault.jpg)
![The Exhaustions Indicator Is Much Better Than You Think [FREE]](https://img.youtube.com/vi/JL0ZXQmZKPo/mqdefault.jpg)
⚡ Saved you 0h 13m reading this? Transcribe any YouTube video for free — no signup needed.