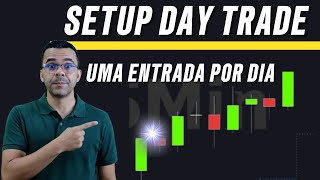

One Trade a Day Strategy Revealed
45sThe promise of a simple, high-accuracy single-trade strategy for mini-dollar futures hooks viewers seeking profitable day trading methods.
▶ Play Clip"Delivers a concrete trading setup with a backtest, but the promise of 'high accuracy' is not statistically proven."
This video presents a day trading strategy for mini-dollar futures, designed for a single trade per day using a 15-minute chart. The strategy relies on a confluence of indicators: an exponential moving average, a parabolic SAR, and financial volume with a nine-period moving average. The presenter demonstrates the setup on a chart and backtests it over several days in January, showing a high win rate and a potential 55% return on a R$1,000 investment.
The video introduces a day trading model for mini-dollar futures using a 15-minute chart, aiming for a single trade per day with high accuracy and performance.
The asset is the dollar futures contract. The chart is set to a 15-minute timeframe. Indicators added: exponential moving average (dashed, thick, fuchsia), parabolic SAR (standard), and financial volume with a nine-period moving average (white, thickness 3).
For a buy: the candle must be bullish (green), the parabolic SAR must be below the candle, and the volume must close above the nine-period moving average. Additionally, the closing price should be closer to the candle's high. The entry is at the close of the candle, stop loss at the low, and target projected the same distance upward (1:1 risk-reward).
For a sell: the candle must be bearish (red), the parabolic SAR must be above the candle, and the volume must be above average. The entry is at the close, stop loss at the high, and target projected downward (1:1).
The presenter backtests the strategy over 15 days in January. Results: 8 winning trades and 3 losing trades. With an investment of R$1,000, the return would be 55% (R$550).
The presenter skips candles with no body (doji) or when indicators disagree (e.g., SAR says buy but candle is red). Only trades with full confluence are taken.
The strategy offers a systematic approach to day trading mini-dollar futures with a single daily trade, emphasizing confluence of indicators and strict risk management. The backtest shows a high win rate, but traders should be aware of potential losses and the need for discipline.
What timeframe is used for the mini-dollar futures day trading strategy?
15-minute chart.
01:08
What are the three indicators used in the setup?
Exponential moving average, parabolic SAR, and financial volume with a nine-period moving average.
01:22
What is the entry point for a buy trade?
At the close of the bullish candle.
03:34
Where is the stop loss placed for a buy trade?
At the low of the candle.
04:55
What is the risk-reward ratio used in this strategy?
1:1 (target is the same distance as the stop loss).
04:55
What condition must the volume meet for a valid signal?
The volume must close above the nine-period moving average.
04:16
What does the parabolic SAR indicate for a buy signal?
It must be below the candle.
04:02
What is the result of the backtest over 15 days?
8 winning trades and 3 losing trades, yielding a 55% return on R$1,000.
11:55
What is the ideal closing price position relative to the candle for a buy?
Closer to the high than the low.
04:30
What should you do if the candle has no body (doji)?
Skip the trade and wait for the next candle.
08:06
Confluence of Indicators
The strategy requires multiple indicators to align, reducing false signals.
03:211:1 Risk-Reward
A fixed risk-reward ratio simplifies trade management and ensures consistency.
04:55Backtest Results
The backtest shows a high win rate (8/11) and a 55% return, demonstrating potential profitability.
11:55Avoiding Inconclusive Signals
Skipping trades without full confluence is crucial for maintaining a high success rate.
08:06[00:02] for trading mini-dollar futures, using a 15-minute chart, for a single trade per day? That's right. I'm going to share with you a really cool indicators so that you can make a single trade
[00:16] per day in the mini-dollar market with a very good level of accuracy and performance. Hey, that's really interesting, isn't it? So what I invite you to do is subscribe receive notifications, and leave a like to encourage our
[00:28] work. I also invite you to follow us on Instagram, where we post mini-index, mini-dollar, and especially about our Goros trading strategy, with interested in our operations, the link to our website is in the video description
[00:41] . Go visit, go see how it works. And if you have any questions, Instagram direct message. I will be happy to answer you. From this my computer screen with you and show you how we prepare the
[00:54] to this operational model. Come with me. Let's go. So, here in the chart, we're first going to prepare it so that we can apply our operational model. Importantly, our asset here will be the
[01:08] dollar futures contract. We're going to set the chart to a 15-minute timeframe, which is very important, and we're going to insert some indicators we're going to put here is a moving average. Then, right-click and select "
[01:22] Insert Indicator". Let's insert the OK. Here again. She appeared here on the screen. We'll set it up like this
[01:38] express it as an exponential moving average . We'll go there based on her appearance. Let's make it three dashed lines thick. And for the color, we're going to use this fuchsia color. Great
[01:57] . Now we're going to insert the indicator that will be essential for us, which is the parabolic SAR indicator , very important for our model. Then, right-click on the chart and select "Insert Indicator". Let's
[02:11] look here for the parabolic SAR indicator . Insert it directly into the chart and click OK. We're going to keep this one standard, okay? The way he came here, we're not going to change anything about him. And
[02:23] now we're also going to insert the financial volume into our chart with some specific settings. Insert indicator. Here on the left side, we're going to define the financial volume.
[02:37] show up here for us. We're going to make some changes. Right-click on the volume bars. The coloring type can be with high and low color. Right-clicking on one of the bars will allow us to insert a
[02:53] nine-period moving average. This moving average, we're going to select it going to select it here, with a thickness of three and a white color. Give it an OK. And so, we already have configured in our chart both the indicators
[03:07] and the moving average that we will need for this operational model. going to look at the market and I'll explain to you exactly what the metrics or rationale are for this model to work. So what do I need to do
[03:21] to open a transaction here? For example, opening up the market. This is the first candle of the day. I need to find some converging information First, it's a buy candle. Yes, it's a green buy candle.
[03:34] Where will the entry point be for this candle? His entry will always be at the close of the closing, I make the entry there seconds before he finishes. In this case, he tells me that it's a candlestick pattern for a buy operation. Looking at the candlestick,
[03:49] it's a buy signal. What does that tell me? First, it 's a bullish candle. Second step, I 'm going to look at my indicator down here, and I understand that it's working below the candle, right? It's here, a little
[04:02] blue one below the candle, indicating to me that it's a buy signal. And down here I'm to give me the following: my trading volume has to be moving with the price , meaning my volume has to close above the nine-period moving average.
[04:16] stopping me here, but could stop me, is this average of 200 being ahead of my reach my target, I would have to pass through the 200-period moving average. If that happens, I don't trade. Ideally, we should always look at the candle and see if its
[04:30] closing price is closest to the candle's high , which indicates a buy signal. Therefore, it needs to be closer to the maximum than closer to the minimum. That would be ideal. It won't be a decisive factor, but ideally we should look for those
[04:42] agreements. When I enter this trade, I enter the market at the close of the candle. Automatically, I have to place my stop loss at the low of the candle, and my target will be projected exactly the same value upwards.
[04:55] Here, for example, the stop loss is 17 points, and the target is 17 points, a one-to-one ratio. Once the entry is made here, in this case, we wait for the movement. Then he goes and hits the target up there
[05:10] , okay? So there's no secret if it's at the point of sale. We're just reversing what I red. The indicator has to be above, it can't be heading towards the 200-period moving average, and in that case, the stop loss will be at the high of the candle, and the target
[05:23] backtest we're going to do here, we'll have buying and selling scenarios, and you Let's go, then. I'm already here on the screen. Let's do a test here for a few days in January, shall we? Day 15, day 16, let's try to do 15 days here to
[05:36] keep track. I'm going to use our spreadsheet here on the channel. Our spreadsheet is also from the Operational Corus training. And this spreadsheet, if there's a link in the video description to access a spreadsheet for you to track
[05:48] place your trades in dollars, indices, and calculations and in the end she also prepares the tax calculation for the ARF (Brazilian Federal Revenue Service) very complete spreadsheet. For those interested, the link to
[06:05] purchase the spreadsheet is in the video description. I'm going to test it using this one, okay? Opening candle of day two, the first day of trading, right? So I have the indicator up here showing me that it's a sale. The indicator is above the
[06:17] candlestick. The candle is red, the volume is above average. From there, I have an entry point at the candle's close, a stop loss at its high, and a risk level, which is giving me 19 points. Next, he activates the entry, makes
[06:32] two more movements, and hits the target down here. First operation, 19 points. This is what happened on January 2nd and January 5th: the green candle indicating a buy signal, volume indicator above average, and indicator below the
[06:45] buy order at the close of this candle. He activates the entry, makes the move, and on the third candle he hits another trade, 15 points on January 5th. Now, on January 6th, I have the opening here with a red candle and an
[07:00] confluence, I'm waiting for the next move. I have another way, candle pointing the other, new inconfluence. And here I have marked a sale for myself at this point. So, to close, I have a sell order, a stop loss at
[07:16] its high, and a projected downward target of eight points here. Next, I capture my target here. So here on January 6th, we had eight January 6th, we had eight game points in the operational area.
[07:32] bullish candlestick with an indicator showing a sell signal. I have no confluence. I'll move on to the next candle here. Then he reverses it. Now I have confluence. Oh, the entry point is at the indicating to me that it's a purchase. So, at this point, I have a buy signal, the stop loss at
[07:47] its lowest point, and the target projected upwards. Then, in the same proportion, 6.5. Basically, he activated the entry point, he comes and hits my target up here. On January 7th, we have 6.5. Very
[08:06] right? It could be a buy here, but it's a candle without a body; it needs at least a small volume of body here, right? We'll move on to the next one. There, he has an indicator saying it's a buy and the candle saying it's a sell.
[08:20] So we don't have agreement on this point. Now, at this point we already have, look, closure here below. I have the body here indicating to us that it's for sale. And from there, I have a sell order at the close, with a
[08:34] stop loss at the high and a projected target down here. He activates, comes, and grabs my target right here. January 8th, five points. Very good. On January 9th, I have the candle indicating a sell signal, the
[08:48] confluence. I move on to the next one, and it's the same thing. So, in this candle here, I have a confluence for buying, closing price here, I have the projected target up there, stop at the low of the candle, basically 4.5, and it
[09:03] comes and the stop is here. So, on January 9th, we had a stop here at 4.5. have here the indicator showing what sales are, financial volume above average.
[09:18] So, at the close of the candle, we have a possibility here to place a stop sale at the high of the candle, with a projected target here below at the low of the candle. So, we have an entry activated, there's movement there, and then this
[09:32] a news day, something quite unusual here, but it ended up stopping us out . So, six stop points on the 12th.
[09:46] the first candle of the day, the opening. We already have the necessary support for the purchase. So, at the opening here we have an entry activated, stop here at the low, target up there, risk-reward at 11
[09:59] points. Basically, it triggers the entry, comes close to the stop loss, follows the movement, continues there, and then comes the stop loss for us. So, on continues there, and then comes the stop loss for us. So, on January 13th, a stop loss of 11 points.
[10:17] indicator here saying it's a sell signal. The green candle here has a very small body inconsistent. I'm waiting for the next candle. It follows the same idea. And then, following that,
[10:29] I have another inconsistency here. And at this point I do have a red candle with an indicator above it, the average, the volume above the average. So, at the close of this candle here, I have a
[10:43] this candle here, I have a sell entry, with a top at seven points and a target at seven points. Here too, it activates the entry and goes straight to the target here. So, on the 14th, seven points. Next, on January 15th, I
[10:56] Next, on January 15th, I have the red candle and above- . So, at the close of the candle, I have a sell order. The stop loss is set at seven points, and the target is also seven points, basically six and a half points,
[11:11] right? So activate the entry, make the move, and come grab my target move, and come grab my target down here, 6.5 on January 15th. red candle, indicator saying it's a buy. Moving on to the next one. Here I have
[11:26] a validated candle. His closing price indicates a buy for us. Stop at the low, target projected up there, risk of 10 points. Activate the entry, make the points. Activate the entry, make the move there,
[11:41] Alvup up here, 10 points on January 16th. So, we're wrapping up our study here with one more operation, okay? I'm not going to do the others, otherwise the video will be too long if we watch it here. So, we had some
[11:55] very favorable operations there, right? We had eight winning trades and had eight winning trades and three losing trades. Well, considering a possible investment of R$ 1,000, that would yield a 55% return. So, R$ 550
[12:09] I told you, a model with a very good success rate for you to trade more calmly, a single trade with an excellent success rate. If you 'm already immensely happy. And all I ask of you is that you subscribe to the channel,
[12:25] notifications, leave a like if you really enjoyed it, and don't forget to follow us on Instagram too. Furthermore, I thank you immensely for Until next time. God blesses. May God be with you. What?




⚡ Saved you 0h 12m reading this? Transcribe any YouTube video for free — no signup needed.