
Simple Binary Options Strategy
43sPromises a simple, profitable strategy with step-by-step instructions, appealing to traders looking for easy wins.
▶ Play Clip"The title promises a simple, profitable strategy, and the video delivers exactly that with clear rules and a claimed 80% win rate."
This video presents a simple binary options trading strategy using the Fractal and Parabolic SAR indicators on a 1-minute chart. The creator claims an 80% win rate and emphasizes strict adherence to entry rules.
The strategy uses a 1-minute chart timeframe.
Add the Fractal indicator with period 3 and invert colors (green to red, red to green).
Add the Parabolic SAR indicator with default settings; color can be changed for visibility.
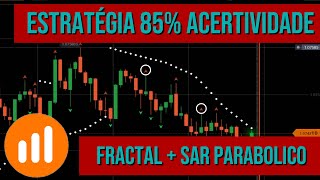
For a sell: Parabolic SAR dot above candle, red fractal arrow appears, and candle is green. Enter on next candle.
For a buy: Parabolic SAR dot below candle, green fractal arrow appears, and candle is red. Enter on next candle.
The strategy claims an 80% win rate but acknowledges occasional losses.
Always test on a demo account before using real money.
What timeframe does this strategy use?
1 minute
00:37
Which two indicators are used in this strategy?
Fractal and Parabolic SAR
00:23
What period value should be set for the Fractal indicator?
3
01:04
How should the colors of the Fractal indicator be adjusted?
The colors are inverted: green becomes red and red becomes green.
01:04
What are the three conditions for a sell entry?
The Parabolic SAR dot must be above the candle, a red fractal arrow must appear, and the current candle must be green.
02:38
What are the three conditions for a buy entry?
The Parabolic SAR dot must be below the candle, a green fractal arrow must appear, and the current candle must be red.
05:40
What is the claimed win rate of this strategy?
80%
05:28
When should you enter the trade after the signal conditions are met?
On the next candle after the signal appears.
04:13
Sell Entry Conditions
Clearly defines the three confluent conditions for a sell trade, making the strategy easy to follow.
02:38Buy Entry Conditions
Mirrors the sell conditions but for buy trades, ensuring symmetry and consistency.
05:40Claimed 80% Win Rate
Provides a specific, testable claim about the strategy's performance.
05:28Simplicity Works
Emphasizes that simple, rule-based strategies can be effective, reducing emotional trading.
06:19[00:02] you all doing? It's me here, and in today's video, I'm going to show you a very simple and very profitable strategy. Okay, if you do it like I'm going to show you in this video, where I'll show you the
[00:15] entry trigger, and if you follow it step by step like I'm going to show you here, you'll stop blowing your account and come out positive every day. Okay guys, so let's go. We're going to use all the indicators here on the
[00:28] IQ Option platform itself. Okay, so let's go. It 's simple. First step, we're going to add an indicator called Fractal. How do you add it? You're going to go to the indicator called Fractal. How do you add it? You're going to go to the
[00:42] remember, guys, remember that here, in the candle period, you're going to leave this strategy for one minute, okay? That's all. Now you're going to go to Indicators, okay? Clicking on Indicators, guys, you're going to go to
[00:57] Popular here, in the Popular option, and it's smaller than in the Popular option. You're going to go to Fractal, clicking on Fractal, guys, you're going to put the period value here, you're going to put Period Three, okay? The candle that you're going to invert,
[01:11] where it's green here, you're going to click In it, put red, and where it's red, you'll put green, okay? And click apply. As you can see, folks, we've just added the fractals, okay? Which are these little arrows
[01:25] here, as you can see. Okay, now we're going to add the other indicator, okay? You'll go to the same place, go to indicators, click and Popular. And now you'll scroll down here, instead of coming here to... How about... you'll scroll
[01:41] down and come here to Parabolic SAR, you'll click on it, folks. Clicking on Parabolic SAR here, you'll leave the value exactly as it is here. You can change the color because... Because the color doesn't interfere with
[01:55] your entry decision. Okay, so here the color, you can leave it white, blue... I'll leave one, it's prettier, okay? Click apply, great, folks. Look, so you can see it's very simple, folks. I'm going to show you the trigger, okay?
[02:09] If you practice with it, folks, I'm not asking you to make the entry in a real account, you'll first use it in a demo account, okay? You'll do the test, right, in the demo account. If you're having top accuracy in that account,
[02:23] you move on to... Okay, so let's go then, guys, it's very simple. I'm going to use my point fix here to teach you, okay here to teach you, okay guys, entry trigger for selling.
[02:36] Let's take the selling trigger, what will be the moment when you click this little button here below, okay, this little button below. Guys, you will only click this sell button when the ball of the
[02:51] sell button when the ball of the parabolic chart is passing parabolic chart is passing over the candle and the arrow appears as you are seeing here, look here so you can see, look here, it has to be in
[03:04] this way that I showed you, okay. That is, the ball of the parabolic chart has to be above the candle, okay, and below the ball of the parabolic chart there has to be the red arrow, to explain here, it's
[03:19] in sell mode. But there's another detail, the candle here, guys, has to be opposite the red candles, that is, the candle that gives the arrow here has to be green, okay, for
[03:31] you to enter, okay, just like it's showing you here, look there, look here, you here, look there, look here, what is a little ball, the ball of the what is a little ball, the ball of the parabolic chart, and the candle has to be green, just like it's
[03:43] showing you. Okay, so what are you going to do? What are you going to do? As soon as you make this confluence, right? The little ball, the red arrow, the green candle? You're going to move to the next one
[03:58] and with a sell here, you would have made a profit right down here. You didn't understand, folks? It's good to recap here: you're just going to click on sell. here: you're just going to click on sell. Okay, when the parabolic ball
[04:13] is passing over the candle, and then a fractal will appear, but the candle has to be opposite the candle, it has to be a green candle. Okay, you're going to move to the a green candle. Okay, you're going to move to the next candle, and it would have given you a win
[04:28] down here. See? So it's very simple. Here's another example down here, look here, look here so you can see here, the parabolic ball appeared, the little arrow here concluding the candle, which is green. So you're going to
[04:44] move to this candle here with a sell and it would have given you a win down here. Okay, it's very simple, folks. It's very simple, folks. Simple things work,
[04:56] folks, it works, it really works. That's it, you can easily make money if you follow step by step. Okay, look here, another example, just here, but three wins here, one win here, another win. Okay, here's
[05:10] another gain, folks. Look here so you can see that the arrow is next to the little you can see that the arrow is next to the little ball, okay, the parabolic is green. You've entered the next one, and give a thumbs up below, okay? Of course,
[05:24] I can't show you the chart moving, obviously, right? There will be losses, there will be gains, sooner or later, it might happen that a new one comes along, okay folks? But its accuracy is 80%, okay? This
[05:39] indicator, what will be the moment you click this little button here to buy? Okay, this strategy is very simple, okay folks, it's very simple. What will be the moment you click this little
[05:51] green button to make a purchase? You will only click this little green button if the green arrow is with the little ball of the parabolic, okay? And the candle has to be opposite, okay? In other words, in this case, the candle has to be red, okay?
[06:06] For you to take the next candle with a buy, and here it would have given you the result up here, folks. Look, folks, the simple works, the simple works,
[06:18] put that in your heads, okay? Then you'll ask, "Rent, but I..." I can't pick the fractal that's the same color, you have to pick the opposite one, because when you pick an opposite fractal it means there's
[06:33] going to be a reversal, so the signal is stronger, the certainty of a bad outcome is much higher, okay guys? So, that's it, guys,
[06:46] a buy, click on this little green button here, if the green fractal arrow appears along with the parabolic dot and the candle is opposite, that is, parabolic dot and the candle is opposite, that is, it has to be the best, okay, for you
[07:00] to take a buy. Okay, so you took a buy on the next candle that took a buy on the next candle that appeared and you were successful up here, okay guys, let's make a deal, do the test for a week using this
[07:14] confluence, don't go outside this context that I showed you here, do the test for a week to see if you'll come out positive or negative, then you'll see what assertiveness will let you come out
[07:29] totally positive for the week because, because, guys, this confluence is very strong, okay, it 's a very strong confluence indeed, so test it, do the test for a week on the demo account and Then you'll be trading on a real account,
[07:45] okay guys? I hope you enjoyed this video. Please leave a like and subscribe to the channel so you don't miss the next strategies. Okay, I'll be signing off here, guys. A big hug to you all and see you in the next
[07:59] hug to you all and see you in the next tutorial video. Bye!
⚡ Saved you 0h 08m reading this? Transcribe any YouTube video for free — no signup needed.