
The Key to Waiting in Trading
40sThis segment introduces the core strategy of patience, which is a universal struggle for traders and creates curiosity about the specific method.
▶ Play Clip"Title promises 'print money' but video shows a risky strategy with unrealistic results; likely exaggerated for clicks."
This video presents a trading strategy for 1-minute binary options on Pocket Option, using Parabolic SAR and Donchian Channels indicators. The presenter demonstrates how to identify entry points when both indicators align, claiming to turn $78 into $5,715 through a series of trades.
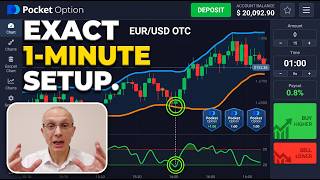
Use classic candlesticks with a 10-second timeframe. Add Parabolic SAR (acceleration 0.015, turquoise, width 2) and Donchian Channels (period 15, hide top/bottom lines, white background, turquoise middle line, width 2).
When candles cross the Donchian middle line from bottom to top, it signals increasing buyer pressure. Confirmation occurs when Parabolic SAR dots appear below the candles, indicating an upward trend. Both signals together confirm a long entry.
After a prolonged uptrend, if candles turn red and fail to make new highs, momentum weakens. When Parabolic SAR dots appear above candles, it confirms a downtrend. Enter short when both indicators align.
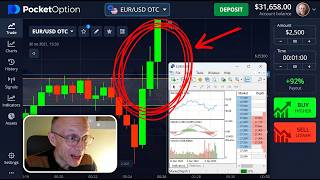
Price accelerates sharply, breaking out of a sideways range with elongated candles. If pullbacks are shallow and buyers maintain control, it's a strong long signal. Expiration 1 minute, trade size $2,000.
In a prolonged downtrend, price moves smoothly downward with small pullbacks. Parabolic SAR dots above candles confirm seller control. Enter short with 1-minute expiration.
The presenter claims to have grown a $78 account to $5,715 using this strategy, emphasizing the importance of waiting for both indicators to align before entering trades. The method is presented as a reliable way to trade 1-minute binary options.
What are the two indicators used in this strategy?
Parabolic SAR and Donchian Channels.
00:35
What is the acceleration setting for Parabolic SAR?
0.015.
00:51
What is the period setting for Donchian Channels?
15.
01:17
What does it mean when Parabolic SAR dots appear below the candles?
The current trend is upward.
02:28
What is the entry signal for a long trade?
Candles cross the Donchian middle line from bottom to top and Parabolic SAR dots appear below candles.
02:43
What indicates a potential trend reversal after a prolonged uptrend?
Candles turn red and fail to make new highs, momentum weakens.
04:01
What is the expiration time for all trades in this strategy?
1 minute.
01:48
What does the presenter claim his balance grew from and to?
From $78 to $5,715.
08:23
Indicator Setup
Provides specific settings for Parabolic SAR and Donchian Channels, essential for the strategy.
00:35Confirmation Signal
Explains the importance of both indicators aligning to confirm entry, reducing false signals.
02:43Trend Reversal Detection
Describes how to spot weakening momentum and potential reversal, a key skill for traders.
04:01Claimed Results
States a dramatic account growth from $78 to $5,715, which is the core selling point of the video.
08:23[00:07] the ability to wait. That's exactly what this strategy is all about. It prevents you from entering the market too early and doesn't react to random price movements. I'll show you how it identifies the
[00:21] moment when the odds are in your favor and why everything starts to click at that exact moment. My name's [snorts] Stanley. Please don't forget to subscribe to this channel and like this video. Let's get started.
[00:35] First, let's set up our tools. I'll use classic candlesticks with a 10-second time frame. Let's go to the indicators tab and select the parabolic SAR and the Donchian channels.
[00:51] Donchian channels. Let's configure the parabolic SAR first. Let's configure the parabolic SAR first. Set acceleration to 0.015.
[01:04] And in the style settings, let's change the color to turquoise and set the width to two. And save.
[01:17] Let's configure the Donchian channels. Set period to 15. Go to style. Let's turn off the top and bottom lines. Set the background to white. Let's set the middle line to turquoise, width two.
[01:32] And save. So, the indicators are ready to go. And my friend, if you are trading on your phone, set them up the same way. My friend, the first entry appears when the market begins to doubt further growth.
[01:48] Expiration is 1 minute and I'm opening a long trade for $78.
[02:00] and what to look out for here. First, let's look at the Donchian channels. When the candles cross the channels middle line from bottom to top, this is the first sign that the market is starting to change direction.
[02:13] This movement often indicates that buyer pressure is increasing and the price is beginning to form an upward trend. And after that, we must check for confirmation using the parabolic SAR. When the indicator starts showing dots
[02:28] below the candles, it means that the current trend is upward. The market is already sustaining its growth and momentum is gradually solidifying. When the crossover of the Donchian channels midline coincides with the
[02:43] appearance of parabolic SAR dots below the candles, the picture becomes clear. Both signals point to the formation of an upward movement and confirm the development of growth on the chart. Let's see.
[03:05] confident start. In my Telegram group, you can do more than just receive information. You can participate in the process alongside me. Every day I share market benchmarks, publish results, and explain the logic
[03:20] behind my actions. You can trade manually alongside me or enable copy trading for automatic replication. Plus, inside you'll find exclusive strategies, bot analysis, and personal support in the chat.
[03:34] The group is completely free, but the number of participants is limited. So, please message me in advance if you want to join in time. In the second episode, actively.
[03:48] Expiration is 1 minute now. And I'm opening a short trade for $149.
[04:01] and formed a steady uptrend. The candles consistently hit new highs and the movement looked confident. But now the first signs that the situation is chart. The candles are turning red. The upward
[04:17] structure is gradually breaking down and momentum is starting to weaken. The market is no longer hitting new highs as easily as before and this is often an early signal of a possible reversal.
[04:30] And after after a prolonged upward movement, buyer momentum may gradually dry up. In such situations, sellers begin to take the initiative and the trend starts to shift downward. Judging by the current chart structure, there's
[04:46] a high probability of a downward forming. profit. That's a great result. Let's keep going.
[05:45] strong impulse. The expiration time is 1 minute. The expiration time is 1 minute. And I'm opening a $2,000 long trade. The price accelerates sharply and literally shoots upward approaching the
[06:00] upper boundary of the sideways range. The movement is rapid, the candles elongate, and increased volatility appears on the chart. Such moments often indicate that the market is attempting to break out of
[06:13] consolidation. But here it's important to pay attention to the reaction after the acceleration. Despite the sharp momentum, the price doesn't encounter strong resistance from above. The candles don't show deep
[06:27] pullbacks and attempts at correction quickly fizzle out. This suggests that buyers continue to hold the initiative. Downward pressure persists and the market doesn't allow the price to
[06:40] sharply return to the range, which may indicate the further development of an And my friend, if you still have questions after watching this video, be sure to message me on Telegram. I'll be happy to help you.
[07:04] profit. I'm continuing. The final signal appears amid a prolonged downtrend. The appears amid a prolonged downtrend. The timer is set to 1 minute. timer is set to 1 minute. And I'm opening a $2,000 short trade.
[07:23] move, the market gradually shifts in character. The price begins to move downward more calmly and smoothly without sharp spikes or chaotic fluctuations. The movement looks neat and directional.
[07:36] Lows are being updated one after another while pullbacks remain small and end This structure indicates that buyers attempt to hold the decline appear weak and fail to gain traction.
[07:50] When the market moves exactly like this, consistently and without strong upward rebounds, it usually indicates that sellers are in control. With this dynamic, the decline can calmly continue until the very end of
[08:04] the session. Let's see. And I've made a profit of $1,840, bringing my balance to $5,715.
[08:23] So, let's wrap things up. My balance has grown from $78 to $5,715. The results speak for themselves. And if you have any questions about the method itself or want to dive deeper into it, please don't hesitate to
[08:37] message me on Telegram. I'd be happy to help you. Well, thank you very much for watching, liking, and subscribing to the channel. liking, and subscribing to the channel. See you soon and happy trading.



⚡ Saved you 0h 08m reading this? Transcribe any YouTube video for free — no signup needed.