

$91 to $6,054 in One Session!
40sExtreme profit claim hooks viewers with curiosity and greed.
▶ Play Clip"Title promises a 'best strategy' and the video delivers a specific method, but the $91 to $6,054 claim is unverified and likely exaggerated."
A trader shares a strategy that turned $91 into $6,054 in a single session using a 30-second chart with Alligator and RSI indicators on Pocket Option. The method relies on crossovers of these indicators to identify trend reversals and enter trades with high confidence.
The trader noticed a pattern on the chart, tested it, and grew $91 to $6,054 by the end of the session.
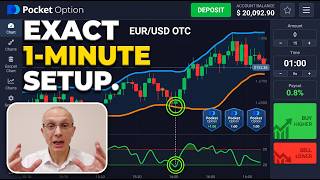
Use classic candles, 30-second timeframe, Alligator (Jaws period 10, shift 5; Lips period 3, shift 1; disable teeth; set lips turquoise, jaws yellow) and RSI (period 10, disable lines 70/30, main line turquoise, line 50 yellow).
When Alligator's turquoise line crosses yellow from bottom to top, and RSI's turquoise line also crosses yellow from bottom to top, it signals a trend reversal upward. Expiration time is 1 minute.
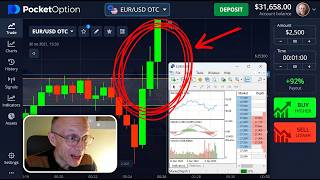
Opened a long trade for $174 after a confident reversal; price rebounded from lower levels with growing candles and consistent upward momentum.
Opened a short trade for $2,000 when downward movement was clear and consistent, with candles forming without pullbacks, indicating a breakout from consolidation.
Opened a long trade for $2,000 after price found support and began recovering; upward momentum was smooth and natural, confirming buyer activity.
Balance grew from $91 to $6,054, with the final trade adding $1,840 profit.
The strategy uses Alligator and RSI crossovers on a 30-second chart to enter trades with 1-minute expiration, claiming consistent profitability. The trader emphasizes confidence in the method and invites viewers to join his Telegram for further guidance.
What time frame does the strategy use?
30 seconds.
00:40
What are the two indicators used in this strategy?
Alligator and RSI.
00:55
What is the expiration time for trades in this strategy?
1 minute.
02:06
How is the Alligator indicator configured?
Jaws period 10, shift 5; Lips period 3, shift 1; teeth disabled; lips turquoise, jaws yellow, width 2.
01:11
How is the RSI indicator configured?
Period 10; lines 70 and 30 disabled; main line turquoise, line 50 yellow, width 2.
01:39
What crossover signals a long trade entry?
Alligator turquoise line crosses yellow from bottom to top, then RSI turquoise line crosses yellow from bottom to top.
02:06
What was the starting balance and final balance in the example?
Started at $91, ended at $6,054.
08:23
From $91 to $6,054
Claims an extraordinary return in a single session, serving as the core hook of the video.
00:08Alligator and RSI Crossover Signal
Describes the precise entry condition for long trades, which is the strategy's key technique.
02:06Short Trade from Consolidation Breakout
Illustrates a short entry based on a breakout from a sideways range, a classic pattern.
05:47Final Profit of $1,840
Demonstrates the claimed profitability of the strategy with a specific trade result.
08:23[00:08] off calmly without any plans or expectations. I just turned on the chart and noticed a pattern that I hadn't noticed before. I decided to test the idea in practice and step by step it proved itself. By the end of the trading
[00:24] session, my balance had grown from $91 to $6,054. And today, I'll tell you how I discovered this pattern and how it helps me open trades with maximum confidence. And of course, I'd appreciate it,
[00:40] friends, if you subscribe to the channel and like this video. My name is Stanley and I'm getting started. First, let's prepare the tools for work. I'm setting classic candles. The time frame is 30 seconds.
[00:55] Let's go to the indicators tab and select the alligator and the RSI. select the alligator and the RSI. Let's configure the alligator first. Let's configure the alligator first. Set jaws period to 10. Jaws shift is
[01:11] five. Lips period is three. Lip shift is one. We go to style and disable the teeth line. Let's set the lips line to turquoise.
[01:25] Let's set the lips line to turquoise. Width is two. And let's set the jaws to Width is two. And let's set the jaws to yellow. Width is two. And save.
[01:39] Set the period to 10. Go to style. Disable lines 70 and 30. Let's set the main line to turquoise. Width is two.
[01:52] Width is two. Let's set line 50 to yellow. And move Let's set line 50 to yellow. And move opacity to the right and save. So the indicators are ready to go. And friends, if you trades on your phones,
[02:06] configure everything in the same way. First situation, the expiration time is 1 minute. And I'm opening a long trade for $91.
[02:20] this strategy and correctly determine the moment to enter. So the first thing to pay attention to is the alligator when its turquoise line crosses the yellow line from bottom to top. This is the first and very
[02:34] important signal indicating a change in the trend direction. Such a crossover shows that the sleep phase of the market is ending and an active upward movement is beginning in which the initiative passes to buyers and this is followed by
[02:50] confirmation from the RSI. Its turquoise line also crosses the yellow line from bottom to top reinforcing confidence in the trend reversal. The RSI reflects the
[03:02] internal strength of the movement. And when it confirms the alligator signal, it indicates that the upward momentum really has potential.
[03:19] in profit. So, I'm continuing to work with the trend. Do you want to understand the market more deeply and get fresh trading ideas every day? On my free Telegram channel, I publish analytics, analyze situations, and share
[03:34] the strategies I use myself. And if you have any questions after watching this video, just write to me and I'll help you. The link to the channel is in the description, so you are welcome to join the community of traders. New situation.
[03:48] The expiration time is one minute and I'm opening a long trade for $174.
[04:00] showing a confident reversal. The price has rebounded from the lower levels and started to move up with good momentum. The candles are getting bigger and more consistent. The direction of movement is clearly visible and the trend structure
[04:14] clearly visible and the trend structure looks clean and logical. Such a recovery after a fall indicates that sellers have exhausted their potential and buyers are taking the initiative. The upward momentum is developing steadily without
[04:27] sharp fluctuations which confirms the strength and stability of the current movement. The market is clearly demonstrating an upward mood. The dynamics are confident. buyer pressure is growing and everything indicates that
[04:42] the upward trend has every chance of continuing with the same energy. Let's continuing with the same energy. Let's see.
[04:55] $160 in profit. Let's move on to the next situation.
[05:47] >> The next opportunity is not long in coming. With an expiration of one coming. With an expiration of one minute, I'm opening a short trade for minute, I'm opening a short trade for $2,000.
[06:01] market has confidently determined its direction. The downward movement looks clear and consistent. Candles are forming one after another without pullbacks or excessive volatility which indicates the stability as strength of
[06:15] uh the downward momentum. And this development is a classic example of a breakout from consolidation when the accumulated energy of the sideways range accumulated energy of the sideways range is realized in a strong trend.
[06:29] Right now the market is moving logically and cleanly and the structure of the downward movement remains smooth and predictable. The signal really looks perfect. The dynamics are smooth. The momentum is
[06:42] stable and the trend is developing naturally. Everything indicates that the downward direction will continue and the downward movement will have good potential for further development. And friends, if you still have questions
[06:55] after watching this video, be sure to send me a private message on Telegram. send me a private message on Telegram. I'll be happy to help you.
[07:10] in profit. My balance is growing steadily. Final situation. I'm setting the timer for 1 minute and opening a long trade for $2,000.
[07:27] finally finds stable support and begins to recover. The candles are getting longer. The upward movement is developing smoothly and consistently without chaotic fluctuations. And this is the first clear sign that
[07:41] the downward pressure has weakened and buyers have begun to show activity. The upward momentum looks confident and natural. Each new movement confirms the strength of the uptrend and you can see how the market is gradually gaining
[07:55] energy and the structure of the chart is becoming clearer and more directional. This price behavior usually indicates the beginning of a reversal. Buyers are returning to the market and forming a new sustainable upward momentum that has
[08:11] new sustainable upward momentum that has the potential for further growth.
[08:23] and I'm making a profit of $1,840. My balance is up to $6,054. So, let's sum up the results. At the end of the trading session, my balance grew of the trading session, my balance grew from $91 to $6,054.
[08:36] Incredible. And if you have any questions about the methodology itself or want to understand it more deeply, please don't hesitate to write to me on Telegram. I'll be happy to help you. Well, thank you very much for watching,
[08:51] Well, thank you very much for watching, liking, and subscribing to the channel.


⚡ Saved you 0h 08m reading this? Transcribe any YouTube video for free — no signup needed.