
The Mind-Bending Escher Paradox Explained
60sThe vivid description of Escher's Print Gallery immediately captures curiosity with its surreal, looping artwork, making it highly engaging for art and math enthusiasts.
▶ Play Clip"The title promises a deep dive into logarithms of images, and the video delivers exactly that with clear explanations and visualizations, though it includes a sponsor segment."
This video explores the mathematics behind M.C. Escher's lithograph 'Print Gallery', where a self-similar image appears to zoom infinitely within a loop. The presenter explains how Escher's intuitive use of a warped grid relates to complex analysis, specifically conformal maps and logarithms, and demonstrates how taking a logarithm of an image can recreate the effect. The video provides both an artistic and mathematical perspective, aiming to make the underlying concepts accessible.
The video begins with Escher's 1956 lithograph 'Print Gallery', which depicts a gallery where the scene warps and zooms as the viewer's gaze moves around the image, creating a self-contained loop.
Escher had no formal math training, yet his art often touches on deep mathematical concepts. The Print Gallery is a perfect example, as it encodes a self-similar zoom effect.
Escher's creation breaks into three steps: 1) Start with a straight self-similar Droste image, 2) Create a warped grid, 3) Use the grid to transfer the image, creating the loop.
The Droste effect is a self-similar image where a picture contains itself, named after a Dutch cocoa brand. Escher used a version where the self-similar copy is 256 times smaller.
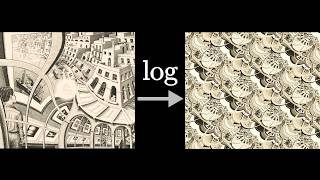
The mathematicians De Smit and Lenstra reverse-engineered Escher's grid, showing it involves taking a logarithm of the original image. This transforms the zoom into a translation.
Escher's grid encodes scaling from one corner to the next. For a scale factor of 256, each corner transition involves scaling by a factor of 4.
The process involves laying a square grid on the original image and copying each tiny square to the corresponding square in the warped grid, which automatically scales the scene.
Escher's grid lines intersect at right angles, making the transformation a conformal map, which preserves angles and shapes locally. This is a key property in complex analysis.
The video provides a mini-lesson on complex numbers, explaining that multiplication by a constant scales and rotates, and that functions like z^2 are conformal.
For complex functions, tiny squares remain approximately square under transformation, unlike general 2D functions which typically distort them into parallelograms.
The complex exponential e^z maps vertical lines to circles, and the logarithm is its inverse, unwrapping circles back into lines. This is crucial for the effect.
For a Droste image, the logarithm produces a doubly periodic tiling pattern, because the self-similarity corresponds to horizontal shifts in the log space.
The process: take a logarithm, rotate and scale the tiling, then exponentiate. This transforms a line connecting the big and small creatures into a closed loop.
The final result is a Droste image with a spiral self-similarity, and the hole in the middle is filled because the exponential covers the entire plane except zero.
The doubly periodic pattern relates to elliptic functions, which are prominent in modern number theory, showing the deep math hidden in Escher's work.
What is the Droste effect?
A self-similar image where a picture contains itself, named after a Dutch cocoa brand.
03:26
What is a conformal map?
A function from 2D space to 2D space that preserves angles and shapes locally, so tiny squares remain approximately square.
12:41
What is the scale factor in Escher's Print Gallery?
256 times smaller.
03:52
How does the complex exponential e^z transform vertical lines?
It maps vertical lines to circles.
22:56
What is the inverse of the complex exponential?
The natural logarithm.
26:03
Why is the logarithm of a Droste image doubly periodic?
Because the self-similarity (zooming by a factor) corresponds to horizontal shifts in the log space, and the exponential's periodicity gives vertical shifts.
29:59
What is a branch cut in complex analysis?
A choice of a band of the plane to make a multi-valued function single-valued.
29:18
What is the formula for the final transformation in the video?
It simplifies to raising the input to a power: f(z) = c * (z - z0)^k + z0, where c and k are constants.
39:27
Escher's Intuitive Math
Shows that an artist without formal training can intuitively grasp deep mathematical structures.
01:34Logarithm as Key
Reveals that the core of Escher's effect is a logarithmic transformation, a powerful insight.
04:37Conformal Property
Explains why complex functions preserve shapes locally, a fundamental property in complex analysis.
16:09Doubly Periodic Log Image
Connects the Droste effect to periodic tiling, which is key to the recreation.
29:59Elliptic Functions Connection
Links Escher's art to modern number theory, showing the depth of the mathematics involved.
42:56[00:00] where the act of animating involves solving a whole bunch of little technical puzzlers, and then the underlying math I'm trying to explain clicks for me in a The best versions of those moments often tell me when a video is
[00:17] this piece right here was one such time when I got that feeling. We begin in the art room.
[00:32] Imagine standing in a gallery, looking at a picture of a boat in a harbour, and the whole world warps as your gaze shifts upwards and to the right, Among the tightly clustered buildings, the world warps even more as your gaze shifts
[00:48] downwards to the entrance of one building, leading to a hallway full of artwork. And at the end of this hall, here you are again, staring at a picture of a boat. Escher's 1956 lithograph, the Print Gallery, or in Dutch, Prentendentunstelling.
[01:05] In a letter that he wrote to his son, describing his creation of a young Escher called this the most peculiar thing I have ever done, Escher's art is widely loved around the world,
[01:21] frequently featuring paradoxical themes or uniquely satisfying geometric patterns This love is especially pronounced among mathematicians, since his art often touches on surprisingly deep concepts within math,
[01:34] despite the fact that Escher himself had no formal training in the field. The Print Gallery offers a perfect example of this unexpected depth. In 2003, the mathematicians De Smit and Lenstra offered a delightful
[01:47] mind-bending self-contained loop that Escher managed to achieve. One of my main goals with this video is to offer a visual unpacking of their analysis,
[01:59] aiming as always to give you a feeling that you could have rediscovered this yourself. the question of what exactly should go in the middle of this picture.
[02:12] If you come at it from the upper right, it feels like it should be featuring buildings in the village, but coming at it from the left, it looks more like part of the picture Come at it from below, though, and it feels more fitting to be part of the gallery itself.
[02:28] whole scene is compressed into that blank circle in the middle. a diffusion model take a stab at filling this in.
[02:41] It just doesn't get it at all. This feels like an intrinsically ambiguous and ill-defined part of the scene. But nevertheless, by the end, I hope you'll agree there is one, and really only one,
[02:57] completion that feels like the right puzzle piece you can slot in. how Escher actually made this piece, which breaks up into three different steps.
[03:10] Step one is to start out with a straightened out version of the same general concept, That picture contains a harbor, which contains a town, that contains a print gallery, that contains that same man, and so on and so forth.
[03:26] You could zoom in forever to your heart's content. This idea of a self-similar image, where the picture is contained inside itself, It's known as the Droste effect, named after a
[03:39] In fact, this seems to have been a somewhat common marketing The self-similar Droste image that Escher was using, though,
[03:52] where the self-similar copy is 256 times smaller than the original. The genius of Escher is that he somehow intuitively realized there must be a way to
[04:08] take this concept of a picture nested inside itself and turn it into this warped loop where the zooming in happens implicitly as a viewer's gaze wanders around the circle.
[04:21] and the answer is that those two mathematicians I referenced generously let us use it. This is something they actually reverse engineered from the original Escher piece using the help of two Dutch artists, Hans Richter and Jacqueline Hofstra.
[04:37] In a certain manner of speaking, it involves taking the logarithm of the original piece. I recognize that sentence probably sounds like nonsense right now, but later on in this video, I promise that will make abundant sense.
[04:52] I want to use an example that's simpler than the one he was working with, creature looking at a framed picture of a house where that same pie creature lives.
[05:08] In this example, the self-similar copy is only 16 times smaller than the original, What I'll do is keep a separate workspace on the right here to sketch out the
[05:20] general goal we have in mind, where the way you might think about it is that you want to distribute that 16-fold zoom-in factor across the four corners of the square. appear about at the same size in the lower left corner.
[05:36] we'll take what would be in the upper left of that zoomed version and then place it in Similarly, zoom in by another factor of 2 and then take the upper right of that zoomed-in
[05:52] version and now place an expanded version of that in the upper right of our workspace. take what's in the lower right of that zoomed-in version, blow it up,
[06:05] These four cut-out corners give a rough idea of what we want to create here. As long as you can find a smooth way to fill in the gaps between them,
[06:17] then as the onlooker's gaze wanders around a circle on this image, what they're seeing will zoom in and in and in until it elegantly joins up with the We could just try joining it all up naively, something like this,
[06:33] and it's certainly not as smooth and as elegant as what Escher managed to achieve, This book that I've been pawing through by the way, The Magic of M.C.
[06:46] Escher, is something that I got on a delightful visit to the Escher Museum in The Hague, and when we turn to the section about the print gallery, For him, step two was to create this warped grid.
[07:03] of that grid that is basically just a little nicer mathematically to generate, In his case, the self-similar Droste image he was working with has a scaling
[07:16] factor of 256, so to distribute that across the four corners, for him it would involve scaling by a factor of four as you walk from one And if you look closely at his grid, say at one of the squares on the lower right,
[07:30] notice how if you follow the top and bottom lines bounding that square over to the lower left of the image, those same lines end up enclosing a square that is now four times as right of a small square from that region, and you follow them upward,
[07:47] So the grid kind of encodes the scaling from one corner to the next that we want. factor of two from each corner to the next, we're going to use
[08:01] a modified version of this, but it'll be the same general idea. but I actually want to postpone that question and skip ahead to step three, which is how you can actually use this grid together with the self- similar Drosse image
[08:16] The way this works is to first lay down an ordinary square grid on the original image, and then let's say you want this portion here to end up in this corner of our final
[08:28] What you would do is take each tiny square inside it and then copy over its contents to the corresponding tiny square in the warped version of the grid. From there, each neighboring square in our original grid is forced to go
[08:42] to the corresponding neighboring square in the warped version, so you can kind of just keep following where the image must go by following the grid. And the fact that the grid lines on the warped version space out by a factor of
[08:56] two as you go from the lower left to the upper left means that the scale of our scene automatically gets scaled up by that factor of two as you walk up that line. it's relatively straightforward to go piece by piece,
[09:12] because at this small scale things are undistorted. It's certainly way, way easier than trying to dream up and draw the appropriate warped final image starting with nothing but a blank page in front of you.
[09:28] So basically with this warped grid in hand, the process of copying over each little square is pleasantly automatic, and if we let this automatic process run all the way around, it nicely closes up with the initial position, and for that to happen,
[09:43] it requires that our original image had this self-similarity when you zoom in by a I hope you'll agree the final result we have is pretty nice, think it gives cause to more deeply appreciate Escher's own composition.
[09:59] He was actually very deliberate about the choice of imagery at all of the distinct scales. To quote, I quite intentionally chose serial types of objects, such for instance as a row of prints along the wall, or blocks of houses in a town.
[10:13] difficult to get my meaning over to the random viewer. and you use the two together to create a warped scene,
[10:26] It's known as a mesh warp, and Escher didn't invent it for this case, it's something that he had used multiple times before for other pieces. For our story, the point is that all of the logic for turning
[10:40] a Drasta zoom into a loop is abstracted and purified into this grid, raising the natural question, where does it come from? You can kind of imagine as an initial naive approach you might try linearly scaling
[10:54] everything from one corner to the next, but if you did that right away you would see a These two scaling processes are placing distinct pressures on the individual squares, where for example this square wants to get flared out in this direction
[11:09] based on the zooming in from the right, but it also wants to get flared Escher was evidently pulled to resolve this by curving all of the lines to relieve this tension.
[11:23] one that presumably made the image transfer process easier, and which will make the ears of any mathematician immersed in complex
[11:36] In his final warped grid, the tiny squares are, well, squares. In most cases, the warped grid lines that you draw don't necessarily intersect at right
[11:51] angles, and the little regions that they bound will in general be little parallelograms. This can still be workable for an artist, you can still kind of do the transfer, but presumably the act of copying over from the original to the warped version
[12:05] so it would be much nicer if in the warped grid, And when you look closely at the grid that Escher used for his print gallery,
[12:17] All the lines are intersecting at right angles, and at a small enough scale, Artistically, this has the nice effect that even though the whole
[12:29] zoomed in at a local scale, everything is relatively undistorted. This is what makes each local part of Escher's image easily recognizable.
[12:41] And mathematically, this is where the story really gets interesting. You see, this idea of a function from two dimensional space to two dimensional space, plays a special role and has a special name in math.
[12:55] It's called a conformal map, and one area where it comes up all the time is in the study of functions with complex number inputs and complex number outputs. At this point, we're going to step back and walk out of the art
[13:08] where I want to offer you a mini lesson on some of the core ideas from this field. The basic game plan from here is that I want to first do a little refresher,
[13:20] and then I want to spend some meaningful time building up an intuition for what logarithms look like in this context of complex numbers. And then once you have that in hand, we're going to step through a completely different
[13:34] way that you can think about recreating this effect that Escher had in his print gallery. We typically think about real numbers as living on a one dimensional line, the real number line, and complex numbers are two dimensional.
[13:48] defined to be the square root of negative one as being one unit above zero, end every other point on this plane represents some combination of a real number
[14:01] It's typical to use the variable z in referring to a general complex number, and the game we want to play is to understand various functions of z. A very simple but important example is to multiply z by some constant.
[14:16] effect of scaling everything up by a factor of two. like i, the square root of negative one? Well you know that multiplying one by i gives you i,
[14:31] Both of these you'll notice are in 90 degree rotation, and more generally, multiplying any value z by i has the effect of a 90 degree rotation. And more general than that, when you multiply by any complex constant,
[14:46] the effect is some combination of scaling and rotating. And there's a nice way to think about exactly how much it should scale and rotate. Zero times anything is zero, so the origin has to stay fixed in place,
[14:58] and then one times any constant c is that same constant c. on whatever that constant c is that we're talking about, and that fully determines the amount of scaling and rotating.
[15:12] A key point to emphasize for our story is that if all you're doing is multiplying by some constant, shapes are always preserved. can get scaled or rotated, but beyond that, there are no distortions.
[15:29] A simple but non-trivial example would be mapping each number z to z squared. So the input two is going to have to move to two squared, which is four.
[15:41] The input i is going to have to move to i squared, which is negative one. And in its fullness, here's what it looks like if I let every point among the grid lines of this input space move over to their corresponding outputs.
[15:57] shape is absolutely no longer preserved. However, and this is a key point, pay attention to what happens at a small scale.
[16:09] As you watch the transformation happen again, you can see that shape is approximately preserved, at least at a small enough scale. square even after getting processed by the function.
[16:26] To use the lingo, the function z squared gives a conformal map. Here's what it looks like if you transform each point z over to z cubed. Okay, maybe this example square that I'm highlighting doesn't exactly look
[16:43] To be clear, this conformal property that I'm talking about is a limiting one. but the idea is that as you zoom in more and more,
[16:55] choosing square regions from the input space that are smaller and smaller, the resulting output will indeed be better and better approximated by a square. choice of polynomials like z squared or z cubed.
[17:08] For just about any function of complex numbers you could think to write down, It's almost like magic. If instead you were thinking of points in 2D space simply as a pair of real numbers with
[17:25] some xy coordinates, and you write down some arbitrary function of x and y to get a new pair of numbers, what is way, way more typical as you let points in that input space get transformed is that the outputs of those tiny squares get squished and
[17:38] Even as you zoom in more and more, the resulting limiting shape typically looks like a parallelogram, not necessarily a square. So, complex functions really are special in this way.
[17:50] And the basic reason that tiny squares remain square comes down to calculus. What you're looking at is what it means for these functions to have derivatives. That might sound a little strange, but the analogy you can think of is that for most
[18:03] functions of real numbers, if you visualize them the ordinary way, just with a graph of inputs on the x-axis, outputs on the y-axis, it looks more and more like a straight line.
[18:17] That is, the rate of change, how much delta f you get for a given delta x, This is literally what it means for a function to have a derivative, Here's a different way to see the same concept.
[18:32] let's think of the same function but as a transformation. line move over to their corresponding outputs on this other number line.
[18:45] What you'll notice is that evenly spaced dots from the input space can get warped in the output space, meaning the rate of change of the function in general is not constant. This spacing between our dots can change from one part of the image to the next.
[18:59] But we know that as you zoom in more and more to a particular output, The dots look more and more evenly spaced. Specifically, if you take a tiny patch of dots around a particular input and you
[19:13] copy them over to the output space around the corresponding output, you can approximately line up all the dots just by scaling everything by a certain This is the same analytical fact as what the slope of a graph is telling you,
[19:28] But this context carries over much more easily to thinking about complex valued functions as transformations in the complex plane. There we're going to think of the neighborhood around a given input
[19:42] and we let each point on that grid move over to its corresponding output. approach a constant is basically the exact same equation.
[19:56] The visual to have in your head is that if you take that tiny patch of squares around the input and copy it over to the corresponding output, you can approximately match this up with the output grid lines by multiplying
[20:08] by a certain constant, which remember, in the setting of complex numbers, means rotating and scaling it in some way, depending on the value of that Since rotation and scaling preserve shape, it means that all the tiny squares from
[20:21] the input space remain at least approximately square under this transformation. So, stepping back, here's the key point, the reason for talking about any of this at all. Even though conformal maps like the one that Escher was using for his print
[20:35] gallery are incredibly constrained and highly unusual among the general ways that you could continuously squish about two-dimensional space, nevertheless, as if by magic, simply by speaking a language of complex numbers,
[20:47] you can somehow create entire families of these conformal maps without even All you do is mix and match standard functions of complex numbers. but this will be true for most of the functions you think to write down.
[21:03] this means that we have an entirely new way to reframe the key question. Can you construct some deliberately tailored complex function so that the act of
[21:15] zooming in around the inputs looks like walking around a loop among the outputs? Now, at this point, with only the bare minimum crash course of complex first building up a larger palette of functions to work with and
[21:31] gaining some familiarity with how they actually behave for complex numbers. In this case, there are really only two functions that you need to understand, I want to settle in and spend some meaningful time understanding both of these,
[21:46] Everybody deserves, in my opinion, at least one time in their life to experience the joy of understanding a complex logarithm. First though, a necessary prerequisite is to understand the complex exponential.
[22:00] e to the power of a complex number, but a review just never hurts. We can start scaffolding the transformation just by focusing on the more familiar
[22:12] examples of real number inputs and the real number outputs they correspond to. For example, e to the 0 is 1, so this point at 0 maps over to this point at 1. the output grows by a factor of e, meaning it runs away from us actually quite quickly.
[22:31] letting it get into the negative numbers, every step to the left corresponds to In particular, you'll notice in this case that output is always a positive number.
[22:44] the inputs and the outputs both be complex numbers. happens as you let the imaginary part of that input increase.
[22:56] And what happens there is that the corresponding output walks around a circle. If you're wondering why imaginary inputs to an exponential walk you around a circle like this, we have discussed it many, many other times on this channel.
[23:10] A key point that I'll reiterate here is that what makes the function e to the z very nice, as opposed to exponentials with other bases, is that as your input walks up at a rate of 1 unit per second,
[23:25] the output walks around its circle at a rate of exactly 1 radian per second. exactly 2 pi causes one full rotation in the output.
[23:37] Phrased another way, these vertical line segments that I've been drawing with heights of exactly 2 pi each get mapped neatly onto one complete circle when you apply the function. You'll notice how I've drawn these particular vertical line segments to be spaced out
[23:52] evenly in the real direction, where the real part from 1 to the next increases by 1. The corresponding circles on the right each differ by a constant scaling factor, Earlier for the simpler function z squared, I showed it as a transformation,
[24:08] And in this case, for e to the z, if you're curious how that same idea looks, it's easiest to take a subset of the grid, like this one here from the input space, and here's what it looks like to move each square over to the corresponding output.
[24:24] it'll be very helpful to anchor your mind by thinking of these vertical lines and the In fact, there's a very playful way that I like to think about how these vertical lines
[24:37] turn into concentric circles and how they can carry the full input space along with them. What I like to imagine is sort of rolling up that entire z-plane into a tube, such that all of those vertical lines end up as circles.
[24:50] Specifically, each circle would have a circumference of 2 pi. Next, imagine taking this tube, lining it up above the origin of the output space, and then kind of squishing it down onto that output space,
[25:02] turning all the circles from that tube into these concentric rings of exponentially That's just what I like, but however you choose to think about it, what I want to be etched into your brain is the idea of vertical lines turning
[25:15] Now, the other very important point to emphasize here is that multiple different inputs can land on the same output. For example, e to the zero is one, but e to the 2 pi i is also one.
[25:29] So is e to the negative 2 pi i and e to the 4 pi i and so on. In fact, the infinite sequence along any given vertical line spaced out by 2 pi will all get collapsed together as that vertical line gets kind of rolled up into a circle.
[25:45] although it might not be obvious how this repetition in the vertical direction is going to be key to our final recreation of the print gallery effect. characterized by turning lines into circles, and the second ingredient
[26:03] we need is the inverse of such an exponential, known as the natural log, where basically the idea is that it unravels those circles back into lines. Now, this will be especially fun to visualize and especially relevant to
[26:15] our story if we imagine painting this complex plane on the right with a Droste image, say the example we were working with earlier with the pi creature looking at a picture of a house where that same pi creature lives.
[26:28] question of what it means to take the natural log of a picture. You already know that a vertical line segment like this one on the left with
[26:42] a height of 2 pi gets turned into a circle when you apply the map e to the z. So the natural log is going to take a circle of points on this image and then straighten them out into one of those lines.
[26:55] Similarly, if you looked at a circle which was exactly e times smaller, that would also get straightened out into a line with the same height positioned one And then similarly, every circle in between these two is going to get unwrapped into
[27:10] one of these vertical lines between those last two, and more generally, smaller and smaller rings from the picture will all get unwrapped into these vertical farther and farther to the left in the image.
[27:24] and there's a number of important things that I want you to notice. and I'll invite you to ponder why that might be the case in the back of your mind
[27:37] for a minute, but before that repetition, I want to talk about a different direction The way I've drawn it so far, the imaginary part for the values on the left are ranging from 0 up to 2 pi, but that's actually kind of an arbitrary choice.
[27:51] Remember, if you keep letting that value z on the left walk up by another 2 pi units, the corresponding value e to the z on the right would just keep walking around that same circle again, so I hope you'll agree it feels at least enticing to let our
[28:05] image repeat in this vertical direction along every one of those vertical lines. And it goes the other way too, as you let the imaginary part on the left get smaller
[28:17] going down, the corresponding value on that right just keeps walking around that same circle, so the pattern that you see should perhaps repeat in that way too. To be more explicit, the rule that I'm using to draw this image on the left
[28:30] you look at the corresponding value e to the z on the right, So for example, this warped pi creature and this one and this one all really correspond
[28:45] to the same part of the image on the right, the big pi creature in the lower left. Another way to think about this is that because the function e to the z is many to one, wants to be a multi-valued function, something where one input maps to multiple
[29:04] Now in practice, many times you don't want a function to have multiple outputs, sometimes that even defies the definition of a function in your context, so people will often just choose a band of this plane on the left to be the outputs
[29:18] In complex analysis, this is called choosing a branch cut for the function. For our purposes though, where we want to recreate and understand Escher's piece, it's actually nice as to think of the log as a multi-valued function,
[29:32] where each point on the right corresponds to a repeating sequence of points on the left, spaced out two pi vertically, going infinitely in both directions. Now in our special case, you also see this repeating pattern as you move to the left,
[29:46] You would not see this for most images. It arises specifically because we're working with a self-similar Droste image, one that looks identical as you zoom in by a certain factor.
[29:59] This falls straight out of a core property of logarithms and exponentials. Exponentials turn addition into multiplication, and logarithms turn multiplication back into addition.
[30:12] For example, imagine taking some small value w on this plane on the right, and also considering 16 times that value, which is scaled up 16 times farther away from Now if we look at the corresponding value, log of w on the left,
[30:28] that act of multiplying by 16 now looks like addition, specifically shifting to the right by the natural log of 16, In fact, this rectangle here in our bizarre warped log image that has a width of log
[30:44] 16 and a height of 2 pi contains all the information about the image on the right. It corresponds to this annulus of the Droste image, and if you were to shift that rectangle exactly log of 16 units to the left,
[30:58] you would get a scaled-down version of that annulus exactly 16 times smaller that And if you repeat that infinitely many times, it gives you
[31:10] this infinite nesting that characterizes the Droste zoom. The way I've drawn things so far, we have this cutoff to the log image on the right side, and at this point you know well that vertical lines on the left correspond to circles
[31:23] on the right, so you can probably guess that this corresponds to the fact that I gave a maximum radius to that Droste image, but of course you don't need to do that. In principle, it can extend out infinitely far in all directions,
[31:35] and the result for the log image on the left would be to extend as far rightward as you want, again with a repeated tiling pattern.
[31:47] So to conclude, the logarithm image on the left is periodic vertically, This would happen for any image. And then in this special case of a Droste image, it's also periodic horizontally,
[32:01] This doubly periodic property is what we'll ultimately And we now have all the foundation we need.
[32:13] the Droste zoom into this Escher-style self-contained loop. so it might be worth giving some space to let this digest.
[32:26] to talk about 3b1b talent, so now might be as good a time as any. This is the virtual career fair that I'm experimenting with this year, and the basic idea is that you, a person who spends their free time learning about
[32:40] things like complex logarithms, are probably interested in working with like-minded, So if you're seeking or open to a new job, check out the organizations at 3b1b.co.
[32:52] When you explore that page, you'll find interviews between me and the relevant teams, and various other things aimed at giving you a feel for the technical team culture.
[33:04] aligned career opportunities, so whenever you are looking for a job, whether that's now or later, be sure to check it out. How is it that we can use everything that we've built up about complex functions
[33:20] and transformations that give conformal maps and everything like that to construct some kind of function that recreates Escher's print gallery effect? and then we can go through each step in more detail.
[33:34] First, take a logarithm, giving this bizarre doubly periodic tiling pattern, and then you rotate and scale that tiling pattern in just the right way, and then from there you take an exponential, which unworps it,
[33:47] This might seem a little bizarre, but there's actually a really nice way to motivate and to understand what's really going on here. and remember how we want to take this big pie creature and
[34:02] somehow identify it with the smaller self-similar copy, 16 times zoomed in. I want you to think about a line connecting both of those. function to transform such a line into a closed loop in the final space.
[34:19] The endpoints of the line on the top represent the big and the small pie creatures, so whatever function identifies those creatures should, at the very least, Now think about what this line looks like in the logarithm of the image.
[34:33] multiple copies here next to the imaginary line. it corresponds to shifting to the left in the log,
[34:45] so these copies in the log image represent that small pie creature. we're going to want to take advantage of the fact that this log image is periodic So instead, what we'll work with is a diagonal line that connects this
[35:03] copy of the big character to this lower left copy of the small one. but the best way to explain why is just to show you how this plays out, you tried using the horizontal line.
[35:19] adding some clockwise rotation to the path in the original image. Remember, our goal is to turn this into a loop in the final image, but you and I just spent like 10 minutes talking extensively about
[35:34] a function that turns line segments into circles, namely e to the z. What you need to do is get that line segment to end up perfectly vertical with a height of 2 pi, and doing this basically comes down to rotating
[35:47] and scaling it in just the right way to give it that length and direction. Now if you remember, as we were warming up with complex numbers, we talked about how multiplication by a constant gives you some combination of
[36:00] rotation and scaling, and in this case, one artistic feature we might like is for our big pi creature on the lower left to stay fixed in that position, and that would mean that this point in our log image needs to stay fixed in place,
[36:12] so instead of pivoting around the origin, we really want everything to pivot Let's say we label that point something like z naught, then here's how the updated formula would look for that rotation and scaling,
[36:25] but really most of the content comes down to choosing this constant c that you might enjoy actually taking a moment to work out what specific value But right here, since we're being very visual and I want to have a little fun,
[36:42] and then also show what happens if I kind of grab it and move it around a little bit. which after exponentiating gives you all these completely bizarre kaleidoscopic images.
[36:58] you're trying to find just the right value that corresponds everything to line up as you need them to in that image of the lower right. in that final image on the lower right, I've been showing this hole in the middle,
[37:16] analogous to the hole that Escher had in his original piece. The output image of the function naturally fills After all, the rotated tiling pattern on the left extends
[37:31] infinitely through the whole plane, so when you take its exponential, it also fills in everything, except for the point at zero. Translate to this bizarre looking log space, rotate and scale to realign things,
[37:47] and then translate back with an exponential. it might be nice to step through what that same process looks like for Escher's specific
[37:59] example, that seaside Maltese town containing a print gallery with a person looking at As before, step number one is to place this scene on its own little complex plane, where the infinite limiting point about which everything scales is positioned at zero.
[38:16] Step two, take a logarithm of this, which in this case gives us a similarly bizarre transformation of the whole scene, but there is a little difference this time. Because Escher was working with a much deeper zoom, with a scale factor of 256,
[38:29] the repeating tiles in this new example actually span a wider part of the complex plane. which depends on multiplying by the appropriate choice of a complex constant.
[38:43] The constraint is to ensure that this rotated image still repeats every 2 pi units vertically, but along a part of the image that was previously diagonal. and what you get is something very similar to Escher's final picture,
[39:00] an image where walking around a loop corresponds to zooming in by a factor of 256. there is no hole in the middle.
[39:12] That final result is itself a Droste image, albeit this time with a twist, where there's a kind of self-similarity spiraling down infinitely far as much as you There are a couple things worth noticing about this whole process.
[39:27] First off, if you write this idea down as a formula, where you take a log, that can actually be simplified to simply look like raising your input to the And if you reintroduce that offset factor, it just introduces another constant.
[39:43] process can be boiled down to so few symbols on the page, but I do think this risks kind of obscuring what's actually going on. if you only tried using those horizontal lines.
[39:58] which would mean rotating everything by 90 degrees and scaling it the appropriate amount. You do get something kind of interesting, but it's just not what we're going for. that you are swapping the roles of rotation and of scaling.
[40:16] Stepping back from all this, this second perspective where the piece is all about rotating in a log space feels completely different from Escher's more intuitive approach using his distorted grid and the mesh warp.
[40:28] For one thing, you can now understand how exactly we've You basically take that same function that we've built up,
[40:40] but instead of applying it to an image, you apply it to an ordinary square grid. It's nicest to work with one that gets more dense as you zoom in so that it looks the same at all scales.
[40:54] When you do this, the logarithm gives you this very beautiful curved tiling pattern. And then from there, you do the same trick of rotating things in just something quite close to what Escher spent many arduous hours constructing.
[41:09] complex numbers is the motivation for me having you jump through those hoops is that this conformal property falls out as a byproduct. square in the final result.
[41:26] and though maybe you and I had to endure a few headaches ourselves for very different reasons, the payoff is that this property is one that we get with no Now to be clear, you certainly don't need to understand complex derivatives or
[41:42] logarithms to enjoy Escher's work, and I wouldn't want to imply that you do. it gives you the capacity for a very different kind of appreciation for what And this is what I find fascinating about all of this,
[41:57] the real connection I want to give between the two storylines. If you look at Escher's career, throughout it he was drawn to certain concepts, And at the same time, he seemed to be guided by a certain aesthetic,
[42:11] often some implicit rigid rule like the idea of little squares remaining little squares The end result when concept and aesthetic are combined like this is that a given piece from Escher often feels like a solution to a puzzle,
[42:25] but one where it's not even obvious that a solution should exist. that he landed on are not merely analogous to the act of doing math. The specific structures that he was intuitively drawn to
[42:40] often hide within them very real and very deep mathematics. the piece can be described with complex functions. a lot closer than you might expect to the research frontiers.
[42:56] remember how it relied on using this doubly periodic pattern in the complex plane, There's actually a special name for functions of
[43:10] They're known as elliptic functions. It would be way too much to explain right here exactly why these functions are so useful, but one thing I want to highlight is that those two mathematicians I referenced at
[43:23] the start, the ones who provided the analysis of this piece, De Smit and Lenstra, are both number theorists, and elliptic functions play a very prominent role in modern number theory, providing a kind of bridge to other parts of mathematics.
[43:36] this piece and think to construct that function that we laid out here. When I look at Escher's work, whether it's the print gallery or many other favorites,
[43:48] the reason I love these pieces so much is that they awaken within me It's a feeling of things perfectly fitting into place. It's something more than just the pleasure of seeing a puzzle solved.
[44:02] to even dream up the puzzle in the first place. So the fact that an artist and a mathematician can be drawn to the same structures,
[44:16] but for completely different reasons, suggests to me that there's something universal in what exactly it is that both of them seem to be drawn to.
⚡ Saved you 0h 44m reading this? Transcribe any YouTube video for free — no signup needed.