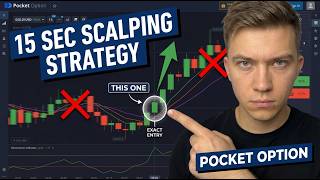

Market Chaos? Try This System
45sOpens with a compelling hook that promises order in chaos, appealing to traders seeking structure.
▶ Play Clip"Delivers on the core promise but heavily padded with promotional content and an overly simplistic explanation"
The video presents a trading strategy for binary options using popular indicators — Alligator and Momentum — to identify market strength, entry points, and trend reversals. Host Steven demonstrates four practical trade setups across different market conditions, from early trend shifts to overheating corrections, highlighting the importance of signal confirmations and risk management. The session concludes with an impressive balance growth from $90 to $6,028.
Configure Alligator on a 15-second time frame: Leaf shapes 1, leaf period 3, jaws shapes 3, jump period 5. Change style to turn off teeth, leaf and jaws both with width 2, in turquoise and yellow respectively.
Momentum: period 7, hist/radius set to 7, and then style: main line, width/height to 1, change to line, outline to turquoise. Save and apply. Setup is identical on mobile devices.
When the turquoise line crosses the yellow line from top to bottom, the market shows downward selling pressure. Momentum cross of the midline from top to bottom confirms downward momentum. In the demo, opening a sell option for 1 minute yielded $82 profit.
When candles close higher with growing bodies and short, small pullbacks, it indicates strong demand and a likely uptrend. Both indicators confirming simultaneously adds confidence. The trade (a buy for $172) made a profit.
In a sharp upward move, price can overshoot its fair level, creating conditions for correction. The indicators pointing downward supported this. A sell trade opened for 1 minute at $2,000 and earned $1,840 profit.
A prolonged flat range often represents accumulation. A breakout above the range with smooth movement and both indicators up can accelerate growth. That buy trade for $2,000 yielded $1,840 profit.
What time frame is used for the trading setup in the video?
15-second time frame.
[00:33]
What are the indicator parameters for Alligator?
Leaf shapes 1, leaf pencil 3, jaws shapes 3, jaw jump 5.
[00:33]
What confirms the first signal: Alligator cross?
When the turquoise line crosses the yellow line from top to bottom, indicating selling pressure.
[01:48]
How does the second signal look for a buy?
Candles have bigger bodies and short, quick pullbacks showing increasing buying pressure.
[02:51]
What is the warning sign from the third signal?
When price moves too sharply, it can overheat and fill over the fair level, leading to a correction.
[04:23]
What is the fourth signal's rule for bullish trade?
When there is a small sideways range and a breakout to the upside happens, the move can accelerate.
[05:32]
Alligator and Momentum Confirmation
Reveals what indicators to use and how to interpret to detect a downshift.
[01:32]Strong Candles and Short Pullbacks
Illustrates a sequential setup for detecting a strong uptrend with indicators also confirming.
[02:35]Overheated Sharp Correction
Explains how to identify an unexpected spike and the rationale behind a counter-trend.
[04:09]Range Accumulation Breakout
Shows how to recognize a consolidation area and the breakout signal that should follow.
[05:17][00:00] Hi, Steven here. If you think the market is chaotic, try looking at it through a system. This strategy shows when the market is actually gaining strength and when it's just noise.
[00:18] Today, I'll break down the logic and show you how to use it without guessing. Thanks for subscribing and liking the video. Let's dive in. First things first, let's set up our tools. I'm using Classic Anos, time frame 15 seconds.
[00:33] Then go to the indicators and select Momentum and Alligator. We'll set up alligator first. Leaf shapes 1, leaf period 3, jaws shapes 3, jump period 5. Then go to style, turn off teeth,
[00:49] set leaf to turquoise, width 2, set jaws to yellow, width 2 and then save it. Now, Momentum, period 7, then go to style, main line, weed the truth, increase opacity
[01:06] and set type to line, set the outline to turquoise and then sync it. That's it, the indicators are ready to go, if you trade from your phone, just setup everything
[01:18] the same way. In my telegram group, I share daily market analysis, results and offer after copy trading. is completely free but access is limited message me to join. Alright first
[01:32] situation happens right when the upward moon starts losing chance expression one minute and I opening a sell trade for now I show you how to use this strategy so it's easy to understand first look at the alligator indicator
[01:48] when the turquoise line crosses the yellow line from top to bottom it's first sign that the market is taking downward selling pressure is increasing and dollar trend starts to take over. Then check momentum. When its line crosses the
[02:05] middle line from top to bottom it confirms downward momentum. The market starts accelerating down and sellers become more dominant.
[02:19] Nice! I made $82 profit. Great start. Let's move on. In the second situation the The market behaves differently. Expiration 1 minute and I open a buy trade for $172.
[02:35] The price starts rising confidently and we see a strong upward move. The candles close higher and higher and the market exhilarates. Notice the candle structure. The bodies get bigger which shows increasing buying pressure.
[02:51] Pullbacks are small and short. Price quickly resumes going up. This usually shows strong demand. When compressions are weak and don't break the structure, the trend often continues further
[03:04] development. Besides that both indicators simultaneously confirm an uptrend giving us more confidence in the growth Amazing I made profit moving on
[03:39] The third signal appears during a strong acceleration.
[04:09] one minute and I open a sell trade for $2,000. The price shoots up quickly, breaking nearby levels easily. The move looks powerful, candles stretch and there is almost no pause. But
[04:23] this is when the market often overheats. When movement is too sharp, many traders enter emotionally and price can move too far from its fair level. After such moves, a correction
[04:36] often happens. That's why I expect a drop here, both indicators also pointing downwards supporting this idea By the way if you still have questions after watching the video feel free to reach out to me on telegram anytime I gladly help you
[05:01] Good trade. I made $1,840. Let's get going. The final signal forms after a prolonged dig climb. Timer 1 minute and I open a buy trade for $2000. The trade looks interesting. The movement is
[05:17] smooth without sharp spikes and both indicators point upward, a good sign. The price is also moving in a small sideways range. These areas often act as accumulation zones before the next move.
[05:32] If price breaks upward, the move can accelerate. That's why I expect growth and break out above the range could lead to a strong upward move and it's looking quite promising.
[05:54] Nice clean execution another $1,840. Balance is sitting right now at $6,020. Let's wrap this session up.
[06:06] The session went really well. My balance grew from $90 all the way to $6,028. A great result. If you have questions or you want to understand the strategy deeper, feel free to reach out
[06:19] to me on Telegram. I'll be happy to help. Thanks a lot for watching, liking the video and subscribing to the channel. Trade smart. I'll see you in the next one.




⚡ Saved you 0h 06m reading this? Transcribe any YouTube video for free — no signup needed.