
How to Identify the Strongest Fair Value Gap
45sTeaches a clear, actionable rule for filtering gaps, which is highly educational for traders.
▶ Play Clip"Delivers exactly what the title promises — a clear, concise method for choosing the right FVG, though it's brief."
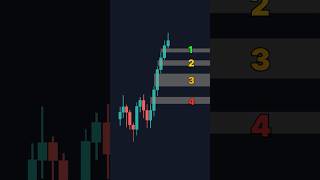
This video explains how to select the strongest Fair Value Gap (FVG) among multiple options by analyzing price reaction and using a 50% mark rule. It demonstrates a practical method to filter out weak gaps and identify the one most likely to hold, using a one-hour chart example.
The video presents a scenario with four fair value gaps and poses the question of how to determine which one is the strongest.
Price comes down to the first gap and instantly breaks through it, closing below. This gap is immediately removed from consideration.
Price closes within the second gap, but the rule is: if price closes below the 50% mark of the gap, it is ignored. This gap is also removed.
Price closes exactly at the 50% mark of the third gap, then prints a rejection candle where price breaks the previous candle but holds above the 50% mark. This is a powerful sign.
On the one-hour chart, these four gaps would appear as one big fair value gap on the daily timeframe. Price rejected at the 50% mark of that daily gap, adding confluence.
With multiple confluence factors, the third gap is deemed the likely one to follow, and price moves up perfectly from there.
The key takeaway is to filter fair value gaps by price reaction and the 50% mark rule, and to seek confluence from higher timeframes to identify the strongest gap.
What is the rule for ignoring a fair value gap if price closes below a certain level?
If price closes below the 50% mark of the gap, ignore it.
00:27
What happens when price breaks through a gap and closes below it?
The gap is immediately removed from consideration as it is not strong.
00:14
What is the significance of a rejection candle that holds above the 50% mark?
It indicates a strong rejection and that the gap is likely to hold.
00:41
How does the higher timeframe add confluence to a gap on a lower timeframe?
Multiple gaps on a lower timeframe can form one larger gap on a higher timeframe, and if price rejects at the 50% mark of that larger gap, it adds strength.
00:54
50% Mark Rule
Provides a clear, objective criterion for filtering out weak gaps.
00:27Higher Timeframe Confluence
Shows how to use multiple timeframes to confirm a gap's strength.
00:54Rejection Candle Signal
Identifies a specific price action pattern that indicates a strong gap.
00:41[00:01] gaps. But the question is, how do we know which one is the strongest? We have gap one, two, three, and four. The main thing you need to focus on is how price reacts to the gap. Here price comes down to the first gap and instantly breaks
[00:14] right through it and closes below it. So now we can instantly remove it from our selection. Next price comes down to fair value gap number two. But this time it closed within the gap, which is good. But I like to have a rule. If it closes
[00:27] below the 50% mark of the gap, I ignore it. So we remove that from our selection value gap number three. And when it does this, it does something extremely interesting. It closes at the 50% mark.
[00:41] But not only that, it prints a rejection candle directly after, where price breaks the previous candle, but yet still holds the position, all while staying above the 50% mark. And here's a secret trick. This setup is on the
[00:54] one-hour time frame, which means if we were on the daily time four of these fair value gaps would just be one big fair value gap. And what's interesting, price rejected right at the 50% mark on that daily fair value gap,
[01:08] which is another very powerful sign. Now we have a lot of confluence that this gap will hold. It can assume the third gap is likely the one we want to follow. And look what happens, price perfectly moves up from here.
⚡ Saved you 0h 01m reading this? Transcribe any YouTube video for free — no signup needed.



![BEST MACD Trading Strategy [86% Win Rate]](https://img.youtube.com/vi/rf_EQvubKlk/mqdefault.jpg)