
Daily Bias in 30 Seconds
30sQuick, actionable trading tip with a clear before-and-after example hooks viewers immediately.
▶ Play Clip"The title promises a simple method, and the video delivers exactly that with clear, concise steps."
The video explains a simple 30-second method to determine the daily bias on any chart by analyzing the latest daily candle against its high and low. It outlines five possible scenarios, each with a clear trading implication, from bearish to bullish to neutral.
Scenario one: price wicks above the daily high and closes beneath it — bearish, expect downward move.
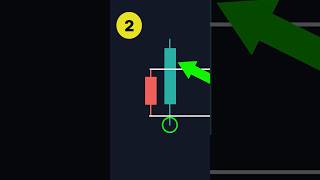
Scenario two: price sweeps below the daily low and closes above the daily high — bullish, expect upward move.
Scenario three: price sweeps both daily low and high — liquidity swept on both sides, avoid trades.
Scenario four: price stays within daily range — consolidation, avoid trades.
Scenario five: price sweeps above daily high then closes below daily low — very bearish, look for confluences for downward move.
What is scenario one in the daily bias method?
Price wicks above the daily high and closes beneath it.
00:28
What does it mean when price sweeps below the daily low and closes above the daily high?
Bullish scenario; expect an upwards move.
00:42
What should you do when price sweeps both the daily low and high?
Liquidity was swept on both sides; avoid taking any trades.
00:42
What does it indicate when price doesn't go above or below the daily low or high?
Prices are consolidating; avoid taking trades.
00:58
What is scenario five and what action should you take?
Very bearish sign; look for confluences for a move lower.
00:58
Five Scenarios for Daily Bias
Provides a clear, rule-based framework for determining market direction in 30 seconds.
00:28Liquidity Sweeps
Explains how liquidity sweeps on both sides signal to avoid trading, a key risk management principle.
00:42Consolidation Avoidance
Emphasizes the importance of patience and avoiding trades during consolidation.
00:58[00:02] said down, congratulations to you. You understand how to find the daily bias. Now, what about this one right here? If you said up, congratulations to you. You understand how to find the daily bias. Now, what about this one right here? Did
[00:15] you say up? Did you say down? Well, the answer is neither. Notice how simple that is. Here's how I find my daily bias in 30 seconds. Go to the daily time frame. Find the latest candle. There are five different scenarios that can
[00:28] happen. Scenario one, price wicks above the daily high and closes beneath it. This is a bearish scenario. Expect a downwards move. Scenario two, price sweeps below the daily low, then closes above the daily high. This is a bullish
[00:42] scenario. Expect an upwards move. Scenario three, price sweeps both the daily low and high. Liquidity was swept on both sides. Avoid taking any trades. Scenario four, price doesn't go above or below the daily low or high. Prices
[00:58] consolidating. Again, avoid taking trades. Scenario five, price sweeps above the daily high, then closes beneath the daily low. This is a very bearish sign. Look for confluences for a move lower.
⚡ Saved you 0h 01m reading this? Transcribe any YouTube video for free — no signup needed.



![BEST MACD Trading Strategy [86% Win Rate]](https://img.youtube.com/vi/rf_EQvubKlk/mqdefault.jpg)