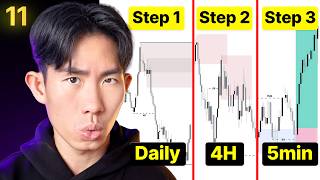

Why You're Confused by Timeframes
42sRelatable pain point for traders who struggle with conflicting signals across timeframes.
▶ Play Clip"Delivers a thorough, practical guide to top-down analysis, though it's longer than necessary with some repetition."
This video explains multi-time frame (MTF) analysis, a core concept in trading that involves reading the market from higher to lower time frames to understand the bigger picture and refine trade execution. The instructor emphasizes that each time frame serves a specific purpose—higher time frames define the trend, medium time frames identify the point of interest, and lower time frames provide precise entry timing—and that the market is fractal, with patterns repeating across all time frames.
Traders often get confused by switching between time frames without understanding their roles, leading to conflicting signals and poor trade decisions.
Multiple time frames don't show different market directions; they reveal different layers of the same market. Each time frame has a specific job.
MTF analysis is the process of reading the market from higher to lower time frames to understand the bigger picture, determine direction, and refine execution.
Neglecting higher time frames can lead to trading against the prevailing trend, resulting in losses. MTF analysis provides clarity, better timing, and prevents forcing trades in the wrong context.
A higher time frame trend is composed of multiple lower time frame trends. Each leg (run) of a higher time frame move is itself a trend on a lower time frame.
Price action is fractal: whatever happens on a higher time frame must first happen on the lower time frame. The same patterns repeat across all time frames.
Traders typically use three time frames: higher (trend direction), medium (immediate bias and point of interest), and lower (entry timing). All three are necessary.
Ask: Is the market bullish, bearish, or ranging? What is price relative to key supply/demand? Is price in premium or discount? Are we approaching a key zone?
The medium time frame determines immediate bias and identifies the point of interest (supply/demand zones, order blocks, flip zones, liquidity zones). It's the sweet spot between higher and lower time frames.
The lower time frame is used for entry confirmation once price reaches the medium time frame point of interest. It allows for tight stop losses and precise entries.
Time frames depend on trading style: scalpers use 1-hour/5-minute/1-minute, day traders use 4-hour/15-minute/5-minute, and swing traders use daily/4-hour/1-hour.
Beginners often start with lower time frames, building bias from noise. Always start with the higher time frame to build the narrative and determine trend direction.
On the 4-hour chart, price is in an uptrend with higher highs and higher lows. The instructor maps out structural breaks to confirm buyers are in control.
A market shift occurs when price takes out the last swing low, indicating a potential pullback. This helps determine the immediate bias on the medium time frame.
The instructor personally uses the 1-hour time frame as a bridge between the 4-hour and 15-minute, though he recommends sticking to three time frames for simplicity.
On the 15-minute chart, price has shifted bearish, confirming the pullback. This tells the trader to look for shorts or wait for longs at discount zones.
After a big move, price needs to pull back to a supply/demand zone to 'grab fuel' before continuing. This is where the trade idea is validated.
The same price action seen on the 15-minute chart (higher highs, break of structure) is mirrored on the 4-hour chart, demonstrating the fractal nature of the market.
Only drop to the lower time frame when price touches a medium time frame point of interest. This prevents overtrading and improves entry quality.
The entry is the last step. The real edge comes from the top-down analysis and trade idea development, not the entry click.
For scalping, the 1-hour is the higher time frame, 5-minute is medium, and 1-minute is lower. The instructor walks through a live trade using this setup.
After a strong bearish displacement, the origin candle becomes the order block. This is the 'gas station' where price is likely to pull back to before continuing down.
Once price reaches the 15-minute demand zone, the trader drops to the 5-minute and 1-minute charts for entry confirmation, achieving a 'sniper' entry.
The instructor held through drawdown because the bullish structure remained intact. Trusting the analysis prevents emotional exits.
Time frames don't conflict; they show different layers. The higher time frame is king, but all three serve a purpose: higher tells who's in control, medium tells where to enter, lower tells when to enter.
Multi-time frame analysis is a powerful tool that, when applied correctly, provides clarity and precision in trading. By understanding that each time frame serves a specific purpose and that the market is fractal, traders can develop high-probability trade ideas and execute with confidence.
What is multi-time frame analysis?
The process of reading the market from higher to lower time frames to understand the bigger picture, determine direction, and refine execution.
02:07
Why do traders get confused when switching time frames?
Because they don't understand that each time frame shows a different layer of the market, not a different direction.
00:44
What does 'the market is fractal' mean?
Whatever happens on a higher time frame must first happen on the lower time frame; the same patterns repeat across all time frames.
07:02
What is the purpose of the higher time frame?
To identify the trend direction and determine who's in control of price (buyers or sellers).
11:34
What is the purpose of the medium time frame?
To determine immediate bias and identify the point of interest (supply/demand zones, order blocks, etc.).
12:27
What is the purpose of the lower time frame?
To look for entry confirmation once price reaches the medium time frame point of interest.
13:20
What is a 'market shift'?
When price takes out the last swing low (or high), indicating a potential change in the immediate trend.
19:18
Why should you start with the higher time frame?
Starting with the lower time frame builds bias from noise and can lead to trading against the higher time frame trend.
16:37
What is an order block?
The origin candle of a strong displacement move, which acts as a point of interest where price may pull back to before continuing.
38:59
What does 'price seeks balance' mean?
After a big move, price needs to pull back to a supply/demand zone to 'grab fuel' before continuing in the trend direction.
25:50
What is the 'gas station' analogy?
Price moves to a supply/demand zone (the gas station) to grab more fuel (liquidity) before continuing its move.
27:38
What is the recommended time frame set for a day trader?
4-hour (higher), 15-minute (medium), and 5-minute (lower).
16:08
What is the recommended time frame set for a scalper?
1-hour (higher), 5-minute (medium), and 1-minute (lower).
37:25
Why is the entry not the most important part of trading?
The money is made in the preparation and top-down analysis, not in clicking the entry button.
36:17
Higher Time Frame Trend is a Lower Time Frame Trend
This is the core principle of MTF analysis, explaining how trends are composed of smaller trends.
04:52The Market is Fractal
Understanding fractality helps traders recognize patterns across time frames and anticipate moves.
07:02Always Start Top-Down
This is a common mistake among beginners; starting with higher time frames prevents building bias from noise.
16:37The Money is in the Preparation
Emphasizes that the entry is just one piece of the puzzle; the real edge comes from the analysis.
36:17Trusting Structure Over Fear
Shows the psychological benefit of understanding market structure, allowing traders to hold through drawdowns.
45:01[00:02] confused is because they keep switching time frames without actually knowing what each time frame is supposed to do. So, they look at the 4-hour time frame and then the 1-hour time frame, then the 15-minute time frame, then the 5-minute
[00:16] time frame, and by the time they are ready to enter the trade, they are completely lost. They look at one time frame and they think that price is actually very bullish right now. And then they switch to another time frame,
[00:29] then they see price is actually very bearish. So, in this case, should I enter for a buy or enter for a sell? Now, the problem is usually not the chart. The problem is that they do not yet understand how to read multiple time
[00:44] frames together. They don't understand that multiple time frames doesn't mean the market is doing different thing. It just shows you the different layers of the market itself. Multi-time frame analysis is not just
[00:58] about looking at more charts. It's about knowing what each time frame is telling knowing what each time frame is telling you and how they all work together. So, that's what we're covering in this lesson. So far, we have already covered
[01:11] a lot of very important concepts like market structure, supply and demand, premium and discount, fair value gaps, order blocks, all this good stuff. In this lesson, I want to show you how to combine these ideas across multiple time
[01:24] The higher time frame will give you the bigger story. The lower time frame will allow you to trade with precision. So, you need to understand how they all work together. When you do, your analysis will be a lot
[01:37] Right. So, with that being said, as usual, I'm just going to go through the theory first, right? Just understand the chart diagrams, understand the logic behind multi-time frame analysis and why we use it. Then later, we are going to
[01:51] go into the charts and apply this. Okay? So, what is multi-time frame analysis? Multi-time frame analysis is basically the process of reading the market from higher time frames down to the lower time frame in order to understand the
[02:07] bigger picture and find direction and refine execution. Quite simply put, you are using multiple time frames so that you can determine the trend direction, so you can trade with smart money,
[02:20] and still at the same time trading with sniper-like precision on the lower time So, it's not just about checking random time frames, it's about understanding each time frame and using each time frame for a very specific job. You are
[02:36] do this, the medium time frame to do that, and the lower time frame to do this. Now, going down the time frames is like zooming into price action. That is why I view top-down analysis or
[02:49] you like to call it as having a microscope. You know, just zooming into what price is doing on the lower time frames itself. Right? That's just you looking at like what you can't see with your bare eyes itself.
[03:03] And the reason why we use multi-time frame analysis is because if you don't, going to get strapped trading against you just only look at the 5-minute time frame and you neglect the daily time
[03:17] frame, what tends to happen is that you look for a sell because the 5-minute next thing you know, price starts going up significantly because the higher time frame trend, the daily time frame trend is actually bullish. And the higher time
[03:31] power and control over the lower time frame trend. So, as a result, you get the wrong direction because you neglected this multi-time frame
[03:43] analysis. So, when you have multi-time frame analysis, what tends to happen is that you have a lot more clarity over the trend direction, which also means that you will get better timing of your
[03:55] entries, and it also means that you will stop forcing trades in the wrong context. So, the like I said earlier, the higher information is. The monthly time frame will be much
[04:09] price action that you see on the weekly time frame is going to be much more stronger and much more significant than the ones that you see on the daily time and so forth. Right? You basically get my point. The higher the time frame, the
[04:24] stronger the price action is. So, if I see like a big bullish candlestick on the daily time frame, this tells me that over the next few days, there's a very high chance for price to remain bullish compared to if I
[04:37] see the same bullish candlestick on a 1-minute time frame. It might just not have as much significance as the one that has Because yes, higher time frame, much more significance, much more powerful.
[04:52] So, when it comes to multi-time frame structure, you must understand this logic right here. If you understand this logic, everything becomes much more simpler. And that is the fact that a higher time frame trend is a lower No, a
[05:06] frame trend. So, what I basically mean by that is that once again, just structure, price is creating higher highs, higher lows. This is a uptrend, right? So, this entire move right here is a trend.
[05:20] But within this trend itself, there are certain legs, right? So, we will call each one of these leg a run. Right? So, price goes up, pulls back, goes up, pulls back, creating higher highs and higher lows. Right? So, each one of
[05:34] these leg where price is pulling back or price is continuing is counted as a run. So, looking at this, it basically said a higher time frame trend is a a higher trend. So, what it basically means is that within this entire leg itself,
[05:50] the higher time frame, but if you go down to the lower time frame itself, you higher lows. Right? Because that's what price will be doing on the internal structure on the lower time frame trend.
[06:05] itself. So, just to give you an example on what that essentially means, right? So, this right here, this right here, is a run, another run, and another run, and another run. Right? So, every time
[06:19] price move up is a run. And then if you look at it using a microscope, right? Which means you jump down to the lower time frame and look at this entire leg right here, what you will see is these gray lines that we have behind the thick
[06:34] black lines right here. This is like the lower time frame structure where price higher highs, higher lows on the lower time frame itself. And then later on, you can see the lower time frame start shifting bearish first, then the higher
[06:47] on. Okay? So, this is what we mean when I say that um price is fractal. The market is fractal. So, whatever happens on the higher time frame, it must first happen on the lower time frame itself.
[07:02] So, another example right here, right? This one is a little bit more complex, but just to show you this entire logic. So, the daily time frame could just be up. Right? Just give you like this blue line that you can see on the screen
[07:15] right here. But remember, within this line itself, if you go down one time jump from the daily time frame to the 4-hour time frame, what you will see is the price creating higher highs and higher lows to form this daily time
[07:30] frame trend, this daily time frame run right here. Right? So, this one daily right here. Right? So, this one daily time frame run is actually a 4-hour time frame trend. Same thing right here, right? And same
[07:43] thing right here. And then within the 4-hour time frame run, right? Which is this push to the upside, pulls back, and then push to the upside, and push back. If you look at each one of these leg, it also further comprises of trends that is
[07:57] perhaps on the 15-minute time frame itself. Right? So, if you look at this might look like a straight line just like this. But if you jump down to the start seeing price creating higher highs, higher lows, higher highs, and
[08:11] higher lows, and all of that comes together and form this entire 4-hour leg here. Same thing within this 15-minute trend itself, there's also your 1-minute trend itself, your lower time frame trend, right? That is going
[08:25] on um in a microscope microscopic level. Yeah. So, you basically get my point right here. So, when you perform multi-time that you're analyzing the charts from the higher time frame down to the lower
[08:38] The higher time frame tells you like where's the institutional flow of money. The lower time frame tells you the precise place and time you want to enter the trades. Right? Which is something that we're going to talk about later on.
[08:51] So, your lower time frame price action forms your higher time frame price action. Okay? So, literally like what we've mentioned, a higher time frame trend, a higher time frame run is a lower time frame trend. So, all of these
[09:04] lower time frame trends, higher high, higher lows, comes together to form your higher time frame run, which is just one straight line to the upside. create your higher time frame runs, right? Like this move to the upside or
[09:18] which in turn creates your lower time frame trends, and then that make up your lower time frame price action. first before the higher time frame actually shift.
[09:33] So, the same patterns actually repeat themselves over and over again. Whatever happens on the higher time frame, must first happen on the lower time frame. have been learning when it comes to market structure, when it comes to
[09:46] premium and discount, you can apply it across every single time frame. But just understand that if you apply it on the higher time frame, it's for a different reason compared to if you're applying it on the lower time
[10:00] frame itself. So, it might take a little bit longer or the idea to actually play out on the higher time frame because you can apply the same strategy, the
[10:12] that you're applying it in time horizon in which the idea can essentially play out.
[10:25] traders, we typically use these three time frames. A higher time frame, a medium time frame, or a lower time frame itself. And like I said, each one of these time frames serve a specific purpose.
[10:38] You need all three time frames. You cannot just have one time frame. You need all three in order to make sense of the market. In order for you to define a trend direction so that you can actually develop a trade
[10:51] idea, so that you can actually get in at the best price, at the right place, at the best price, at the right place, at the right time. lessons I talked about how success in trading requires you to form the right
[11:05] trade idea at the right place, at the right time. So, that's what this multi-time frame analysis is about. It allows us to achieve that. I'm going to show you some examples on like what time frames that you can
[11:19] medium time frame, and lower time frame later on. But for now, I just want you to really just understand the purpose of each one of these time frame right here. the narrative. It's used to identify the trend
[11:34] direction. Okay, so this is the time frame that tells you who's in control of price, supply or demand, buyers or sellers. the prevailing trend direction so you can trade with it.
[11:48] So, when you are on the higher time frame, you want to be asking yourself these few questions. Is the market bullish, bearish, or ranging? What is What is price relative to key
[12:01] supply and demand? Is price in premium or discount? something that we can talk about in the next few lessons. Are we approaching an zone? Because if we are, then we are expecting
[12:15] a reaction from that area. And then for your medium time frame, determine your immediate bias, which is what price is doing right now. And you can also use it to identify your
[12:27] point of interest, aka your supply and demand zones, your order blocks, your flip zones, your liquidity zones. So, after the higher time frame gives you the trend direction, the medium time frame helps you refine the dealing
[12:39] range, the range in which you want to focus on, the exact zone in which you want to enter the trade from, the internal structure, and whether price is approaching your area properly. Right? So, medium time frame is like
[12:51] that sweet spot between the higher time frame and the lower time frame. It's the Okay, so it allows you to like just get more clarity over what price is doing, gather more evidence, right? Before you actually look for your entry.
[13:06] you are looking for your entry, which is usually your point of interest, right? order blocks. And then, once price mitigates or touches or enters the medium time frame point of interest, your supply and
[13:20] again, this is where you can jump down to the lower time frame. And the lower time frame is for you to wait for price to enter into your area, and then when it does, look for your entry confirmation, look for your
[13:33] entry model, and then once that presents itself, you enter into the trade with confidence, without any fear, without any hesitation, you just enter with confidence once you have seen your confirmation on this time frame itself.
[13:47] entry, you can have your tight stop loss, and place your take profit right here. So, as you guys can see, each one of these time frame has a specific purpose, and if you combine all of them together,
[14:00] what it is. You will have the best chance to actually read price for what it actually is. So, yeah, let Make sure you utilize these three time frames itself.
[14:15] So, with that being said, let's go on to the charts right now and try to apply learned. So, I'm going to give you some example, right? Maybe the first example that I want to showcase to you guys is
[14:29] on EUR/USD, right? So, let's look at EUR/USD chart together right here. on the top left-hand corner, you have seen I've laid out a set of time frames,
[14:44] right? For you guys to actually copy. Depending on your trading style, you're time frames. So, it's very important that you actually take the time out to determine which trading style suits you the best. Right? And you're able to find
[14:57] out based on your commitments, your lifestyle, your risk tolerance, and your goals. Okay, so once you have decided which trading style, right? You want to trader, which is people who are holding the trade for more than 24 hours, after
[15:11] a few days, or even a few weeks, or a day trader, which which is just opening and closing a trade within 24 hours, not trying to hold the trade overnight, or traders who are getting in and out within a few minutes, anywhere under
[15:25] Once you have decided which trading style you want to specialize in find that trading style, and then stick assigned to. Okay, so if you're a scalper, this is
[15:38] If you are swing trader, this is going to be the time frame that you're using. this will be your medium time frame, and this will be the your lower time frame. Okay, so yeah, just now we have already like talked about the purpose on like
[15:54] each one of these time frames. I'm not going to dive deeper into this right here. I'm just going to show you how to actually do this multi-time frame here. So, in this case, I'm just going to use
[16:08] um the day trader set of time frames as an an example for you guys, right? So, means my higher time frame is the 4-hour, my medium time frame is the 15-minute, and my lower time frame could be the 5-minute time frame itself.
[16:22] here. So, first things first, start from your higher time frame. All right, that's the first thing. approach. You want to take a top-to-bottom approach. What I basically
[16:37] mean by that is that a lot of times beginners tend to start with the lower time frame, right? So, beginners, they immediately like to jump to the 5-minute here. If price is going down, they just enter for a sell here.
[16:49] frame, see price is going up, they just enter for a buy somewhere around here. That's not how you should be trading. Because if you start from the lower time frame, you're essentially building a bias from noise.
[17:01] little significance over like where price is potentially heading towards next. Right? So, what you want to do is Okay, so once again, let me just put it
[17:14] into simple English. If you trade and you start on the lower time frame, 15-minute time frame what you're essentially doing is that you're putting blinders on yourself. You know those horses with like the blinders
[17:28] on themselves which prevents them from seeing their surroundings? That's what You will only be able to see what price is doing on the 5-minute, and you will on a higher time frame, which is actually the price action that determine
[17:43] where price is heading towards next. So, even though price is going down on the 5-minute time frame, you enter for a sell, next thing you know, price start reversing heavily against you because the 1-hour time frame, the 4-hour time
[17:55] frame is heavily bullish right now. All right, so always start top-down, not bottom-up. Start with the higher time frame, right? the 4-hour, and this is where you want to build your narrative and determine
[18:09] your trend direction. So, clear as day, price has been going highs, higher lows, higher highs, higher lows. This is where I want to take my um line tool and just map out all the structural breaks that has been going on
[18:23] for the past few days, right? So, there's one right here. Okay, so and then there's maybe another one right here.
[18:38] Okay, so just by doing this alone, I can see that okay, all of these are actually my bullish break of structure, where price is just going up, creating higher highs higher lows, higher highs, and higher
[18:51] And just by doing this alone, I know that the market is in an uptrend, which means that buyers are in control of price. Okay? Buyers are in control of want to trade with the trend direction, the higher time frame trend direction
[19:05] this is where I will potentially want to look for longs at demand zones that is Just like what we have covered for the past few lessons. So, after you determine your swing structure, this is where you can
[19:18] right? This will be the swing low, but you can see the swing low has been taken out recently since this is the lowest point to the left to the most recent break of structure, therefore creating a market shift.
[19:30] All right, so what does this tell us? This tell us that right now price have potentially shifted bearish so that it can pull back to this last low right here before continuing bullish. At least
[19:44] could potentially do. Okay, for me to know for a fact that price is going to shift bearish I want to see price take out this low here. Okay, so over here if price just take out this last
[19:57] last low right here last internal low. This is just price shifting bearish in pullback. So right now, even though higher time is price doing right now? Okay, so that's another thing. That's
[20:12] what we use the medium time frame for. What is price doing right now? We need to determine our immediate bias so that we can trade with the internal order immediate price action which is what price is doing right now.
[20:25] could have done on the higher time frame is to like once again just map out the is to like once again just map out the previous low right here. Swing low and then this your swing high. If you want to be like super duper
[20:39] this out as your internal break of structure instead of So if that's the case then this is the swing low and this is the swing high. shifted bearish to facilitate the pullback itself.
[20:54] one step further to map out your premium and discount. And then you will realize that price is still quite high up within the premium pricing. So if I want to look for longs, I do really want to see price comes down
[21:06] into this discount range right here. And ideally I want to see it mitigate some form of demand zone. Right? So once again, then there's potentially another demand zone over here.
[21:22] I want to see price comes down mitigate this zone or this zone and then I can particular direction itself. So that's what you essentially do on the higher time frame. You just build the narrative. You just try to figure out
[21:35] what is the market show tell trying to tell you right now and what is like who the buyers or the sellers. Once all of this is done then this is frame. So for me personally when I'm trading, I
[21:50] like to use the 1-hour time frame my medium time frame. Right? So I like Even though here only recommend you to use one,
[22:02] I personally like to use both. Right? Because to jump from 4-hour to 15-minute it's like a very big gap. So I prefer to use 1-hour as like the middle man once again, completely up to you. I just wanted to show you three time frames for
[22:17] a lot of you guys are not ready to have four different time frames. three time frames. Having four is like it's just going to drive you mad, isn't it? So yeah, I would say like stick to whatever works
[22:31] best for you, but this is based on how I personally trade. I like to have the 1-hour as like a like a sweet spot like like a like the the the the best medium time frame between the 4-hour and the lower time frame
[22:44] which is the 5-minute time frame. So on the 1-hour time frame itself, you bearish. Okay, cool. Let's go down to the 15-minute time frame which is our officially medium time frame and this is where you can see 15-minute time frame
[22:57] has already shifted bearish. How do we know price shifted bearish? Price came last higher low giving us a market shift. Okay, so just by that alone, we know that okay, right now the internal
[23:11] structure is actually bearish. So if we enter for a buy somewhere around here, it's kind of trading against the lower time frame trend. It's also trading time frame trend. It's also trading against the internal order flow.
[23:23] Right? So maybe it's not the best time to look for shorts. look for longs. Maybe it's a good time to look for shorts. At least short it all the way till price comes down to the discount
[23:37] or this demand zone right here. want to trade counter trend. Right? The reason why I say it's counter trend is because right now lower time frame is bearish, but the higher time
[23:49] So if you were to look for short, you are actually trading with the internal structure, but you're trading against the higher time frame swing structure the higher time frame swing structure itself.
[24:03] frame on my medium time frame, what is my objective? My objective is to determine the immediate bias and map out any point of interest. bias is that price is actually bearish. And then this is where maybe I want to
[24:17] structure as high. Uh structure as well, 15-minute swing high and then 15-minute swing low right here. And then this is where I can potentially wait for price to pull back to some form
[24:30] of supply zone then look for shorts. Right? So this is where I can come here try to identify every supply zone over here. There's one over here on the right there. And then there's maybe another one right
[24:43] Okay, another one right here. And then this is where once again, you can use the premium and discount as well. Right? Drag it from the swing high to the swing low, you will see that over here price is still within the discount zone.
[24:58] So if you want to look for short, it's might be a little bit too early. Right? price comes down up to this supply that is within the premium pricing or even this one right here. Get your entry confirmation, get your
[25:11] the way down here. Now you can start to see the different together. Now you can start to see it, okay, I need to use supply zone plus premium and discount plus structure plus multi-time
[25:24] develop a trade idea that is congruent with the market. Now I can start to use all of these market mechanics concepts to try to
[25:36] tell me. Yeah, so I'll say like in this case, I want once again, I'm not going to dive too deep into entries and a lesson where we talk about multi-time frame analysis. Right? But I wanted to
[25:50] is where price is at right now. Let's observe. Okay, price is actually bullish right now. Okay, are we surprised that price is bullish? No. Why? Because just like what we have mentioned, the
[26:02] market cannot go down forever. It cannot go up forever. After a huge move to the downside, it needs to seek balance again. It needs to get more fuel. And where is it most likely going to get fuel from? It's going to get fuel at
[26:14] But is it any supply zone? No. It's usually going to be at a supply zone that is located within the premium range above the 50% equilibrium level within the swing range itself. Right? Because this is where the
[26:29] where there's more sell orders for price to continue going down even further. Okay, so just as what we predicted, here. Now if you are a scalper, this is where
[26:42] this move right here. Or even if you're an intraday trader, right? You can try to this area here. And I'm going to show you how to do that right after this I've taken which is me literally
[26:57] capturing this move right here. Okay, and I'm going to walk you through entire trade and how I apply multi-time frame analysis on it. ahead of ourselves. Let's just continue to observe what price does. Right?
[27:10] Because this is where I wanted to really see how powerful this multi-time frame analysis thing is. Okay, so over here, What happened is that price has literally came up here mitigate the
[27:24] pricing. So you can see price did not start coming down when price came up here. No, there was not enough fuel. So it needed to continue going up till it comes to the gas station, grab more fuel
[27:38] comes to the gas station, grab more fuel then go down. nothing at that that happens in the market is mere coincidence. Right? Every single move is planned out. Every single move has a purpose.
[27:52] So in this case, the purpose was that price just needs to go up there grab actually happens. Now I want you to observe what price When price mitigate this supply zone to grab more liquidity,
[28:05] have right here that is being formed. Price goes up, pulls back, goes up, pulls back, goes up, pulls back. So we know that price has shifted bullish and higher lows on the 15-minute time frame. But does this mean that price has
[28:19] shifted bullish because [snorts] the trend is reversing? No. If price take out this higher, then yeah, maybe price is reversing. this just tells us that price have shifted bullish in the short term to
[28:33] facilitate the pullback. Okay, facilitate the pullback to this supply zone. And when it does that, this is where price consolidated a little bit. Later on price came down take out the last internal low giving us
[28:46] a market shift which tells us that the internal structure has shifted from bullish to bearish. So if you were to look for shorts, the best place to look for shorts is at this supply zone that is within the premium
[28:58] confirmation that the area that the structure is shifting bearish, by all means go and look for short and this is where you can trade it all the way down here or even to here if there is enough fuel in the market.
[29:16] does this look familiar to you? Right? Like does this look familiar to you? obvious, this is the last break of structure right here. out the last internal higher low giving us a market shift.
[29:31] I want you to take a snapshot of this price action here. price action here. This portion here. Right? Remember this. Now this is what price is doing on the 15-minute time frame. Let's go back to
[29:43] the 4-hour time frame. Do you see it now? It's literally the the exact same price action just on a different scale, just on a different price just on a different time frame. That's what I mean when I
[29:56] will see the same patterns across different time frames. Just now on the 15-minute time frame, we saw price goes up, pulls back, goes up, pulls back, and breaks structure causing the internal structure to shift
[30:09] Guess what? On the 4-hour time frame, we have seen the exact same thing. After market shift is formed, price is pulling back, and then now it's going to start Let's go back to the 15-minute. After the market shift is formed, price
[30:24] down. Same exact price action. That's how you apply multi-time frame analysis. Okay? So, now let's just continue to observe what price does.
[30:39] Okay? So, price continue going down, continue consolidating around here, la la la, right? Creating a lower high, and then comes down. Okay, cool. frame since we haven't talked about the lower time frame yet. So, you only enter
[30:52] case trader, you only go down to the lower time frame once price have touched your medium time frame point of interest.
[31:07] This prevents you from trading when price is in the middle of nowhere. let's say price was over here. Okay? Price is over here.
[31:20] supply zone, this one right here and this one right here. So, these are the two locations in which we want to enter the trade from. This means that when price is hovering around here in the middle of nowhere, we
[31:34] do not go down to the lower time frame. I'm not going to jump down to the the 1-minute time frame, I'm doing nothing until price touches either one of these zone here. So, I'm still over here waiting very patiently, or maybe I
[31:47] the edge of the zone, and then I just wait. Boom, the minute price touches that zone, you jump down to the lower time frame to look for your entries. 5-minute time frame, your lower time frame to look for your entry
[32:02] confirmation. You look for entry triggers, look for entry confluences. And then once you got your entry confluences in this time frame itself, then you can look for shorts. Right? So, we're going to delve deeper
[32:15] into entry confluences, entry models in the next few lessons, right? But for now, just to give you like a quick little example, right? So, in this case, look at the internal structure. Price came up here, came down,
[32:28] and then took out this high here as well, right? Took out this high here. But this turns out to be a liquidity sweep. After the liquidity sweep, price came down and took out this last low over here, giving us a market shift.
[32:43] the entry models that you're going to be learning very soon, but once you see learning very soon, but once you see this pattern itself, mitigate the zone, this is where you can look for shorts. Right? This is where
[32:56] you can look for short, and then this is where you can look to short it all the Right? So, once again, we're going to delve deeper into entries and exits in the next few lessons. For now, just get really good at using these different
[33:09] time frame. Okay? So, in this case itself, I'm not sure why TradingView is taking so long to load these days. It's really testing Okay, let let's just wait a little bit, man.
[33:22] man. Yeah, so anyways, in this case itself, what happened was that the lower time frame, the 5-minute time frame started shifting bearish first before the higher time frame, the
[33:34] 15-minute actually shifted bearish. Okay? You guys saw this was the lower 5-minute structure started turning bearish first, then the 15-minute time frame started turning bearish. So, like I said, whatever happens on the
[33:47] higher time frame, it must first happen on the lower time frame. So, in this case, let's continue to observe, right? What price does.
[34:01] here, price started shifting bearish, la la la. Okay, cool. And then we got a here, and then now price is creating lower lows, lower highs, lower lows, and then lower
[34:14] highs again. And once again, this is the beauty of market structure, right? So, break of structure, and look at where price pulled back to. Or if you want to make it even more refined,
[34:29] guess what? What is this? This is your good old fair value gap, right? Fair value gap, imbalance, right? Another imbalance right here, over here. Okay? So, this is actually a good old
[34:41] Okay? So, this is actually a good old juicy order block. just that I just walked you through, this is a 15-minute order block, right? So, on the medium time frame, we have
[34:55] is bearish right now, and we have mapped out our point of interest, which is the 15-minute order block that we have right here. So, in this case, around here. I'm not doing anything.
[35:10] I'm not jumping down to the lower time frame. I'm not going to be getting itchy here. No. I won't wait for price to come to price to come to me. Okay? So, in this case, I'm waiting, I'm
[35:23] waiting. Okay? Price comes up to this fair value gap. Now I'm interested, right? If I can see a reaction, if I can see the confirmation that price is going shorts. Right?
[35:35] could potentially have caught this move right here, this tiny move right here after the the fair value gap itself. But let's say you missed this move here. You do nothing, right? You are very patient. You tell yourself that you
[35:48] don't chase trade. Okay, the move has already happened without me. Now I'm my next point of interest, which is the order block. Okay? So, the minute price this, boom, straight away, go and look for
[36:02] entry confirmation on the 5-minute time frame itself, right? The lower time confirmation, by all means, take a good old short position right here, and then watch price collapse. Right? You can see
[36:17] the entry is the last thing you do. The money is not made in clicking the The money is made in the preparation that comes before that. The money is made in the entire top-down analysis, the multi-time frame analysis.
[36:31] analysis, the multi-time frame analysis. The trade ideal, the entry is only just one little piece of the entire puzzle itself. high R trades, when you see me making six figures on a given trade, understand
[36:45] that it was not because I identified a bearish candlestick at this zone that I enter for a sell. No, it's because of what came before that. How I developed analysis. So, the entire process contributed to me
[37:00] catching this trade itself. Okay? So, that's multi-time frame analysis, right? I've pretty much walked you guys through how to use these three set of
[37:12] time frames as a day trader. Now, maybe let's try to look at another example on a live trade I've taken, but this time around, let's look at it from the eyes of a scalper. So, if I'm a scalper today, I'm going to
[37:25] be using the 1-hour time frame as the higher time frame, the 5-minute as my medium time frame, and the 1-minute as my lower time frame itself. And that's what we are doing in this case itself. Okay? So, right here, I'm on the 1-hour
[37:39] Okay? So, right here, I'm on the 1-hour time frame here. maybe let me just see. Yeah, let's just go back to where price was like my entry. And I can walk you through everything.
[37:52] So, let's say right now, 1-hour time frame, I'm a scalper today. I'm getting really need to care about what price is doing on a daily time frame or the weekly time frame, because I'm literally developing my trade ideal within the
[38:04] next few minutes and just getting out within the next few hours, right? So, the daily time frame, the weekly time frame doesn't really concern me as much trader. It still affect you, right? Don't get me
[38:17] higher time frame trade ideal is always going to be much more stronger than what So, if you want, you can still take a look at it, right? But just don't put too much significance over the daily time frame itself.
[38:31] Because you as a scalper, your higher time frame will be the 1-hour time frame So, 1-hour time frame is my higher time frame, and I'm developing my trade bias by identifying the trend direction and mapping out structure. Right? So, you
[38:45] can see price has created a bullish break of structure, bullish thing is that the market has shifted bearish when price took out this low over here. So, this is where I had my good old
[38:59] So, this is where I had my good old market shift over here. that this is my 1-hour swing high, and this is my 1-hour swing low. This is the
[39:13] And after this huge imbalance to the downside, I'm expecting the market to come up to a balance again. I'm expecting price to start shifting fill up all of this imbalance on the left-hand side right here. So, this is
[39:26] tool, drag it from the swing high to the swing low just like this, and this is the order block in which I can expect price to gravitate towards next.
[39:38] That's me plotting out the gas station that price is moving towards next to grab more fuel before going down even further. So, in this case find the imbalance, right? Find a strong displacement, huge displacement right
[39:52] here is the origin point, so this becomes the order block. So, this one is very obvious, right? Because we got a huge strong bearish candlestick right here. And the origin point is this
[40:05] candle here. So, that's the order block and then you can also map out the other supply zone if you want up here. Right? So, this tell me that the first place that price is moving towards next is going to be this order block.
[40:22] the 1-hour time frame. I've identified the trend direction, which is bearish. could potentially shift bullish in the short term to facilitate the pullback. higher time frame is telling me that price is bearish if I jump down to the
[40:36] lower time frame and the medium time frame to determine my to develop my immediate bias, I will actually be looking for longs, right? Because I want to trade this pullback all the way up to this supply zone right here, right? Or
[40:48] So, this is where I jump down to the 15-minute time frame. And same thing, right? You can map out your 15-minute high and 15-minute low range in which we are focusing on. And you can also map out any other
[41:03] or order blocks that you have missed on the higher time frame itself. 1-hour order block that we have mapped out. And then I also map out this other 15-minute supply zone right here. Okay? The reason why I mapped that out
[41:17] and then goes up. And it is also order block. It's not just a supply zone. candlestick, there was imbalance. Right? So, this is the order block. So, you can see if you didn't do this on a medium time frame, you would have
[41:30] missed this point of interest itself. You have missed this step. Okay? Anyways, in this case we got the 1-hour order block that is situated quite high up there. And then there's this 15-minute order block here.
[41:42] All right? So, this is where price is moving towards next. Because the market is moving from imbalance to balance to imbalance again. yeah? Okay, so that is my target. But where do
[41:57] Well since I'm trading the pullback, I duty want to look for longs? I don't want to look for longs when price is at a high. just created a new higher low. And right now price is going to go up just like
[42:12] So, in this case I map out my 15-minute structure and I found out that price is creating higher highs, higher lows just like this. came up there, create a high, swap some liquidity, and then go up there, break
[42:25] Same thing right here. demand zone that led to the previous break of structure. I saw price mitigated that zone and this is where price started shifting bullish. And I
[42:37] to continue bullish until it reaches this area here. All right? So, this is where I map out my lower time frame demand zone. And the minute price step into this area here, then this is where I jump down to my
[42:49] 5-minute time frame and I look for my entry. Okay? Jump down to my lower time entry. Okay? Jump down to my lower time frame to look for my entry itself. So, I personally like to use the 15-minute
[43:01] as the medium time frame. And then the 5-minute and 1-minute as So, I will actually use both the 5-minute and 1-minute as the lower time 5-minute to just, you know, get my entry. 1-minute sometimes to just refine
[43:14] my entry even further, right? Just to get like even more of a sniper entry. So, in this case what do we have? We got price mitigating higher low, and then right now price is giving us clear as day bullish
[43:27] confirmation that tells us that price is going to head up this way here. So, this is where look for longs here. Okay? After I look for longs, price started coming up here. And then this is where I believe I placed my stop
[43:39] loss like below this low initially. I forgot where exactly I placed my stop below this low. And then eventually I moved it up to a below this low because I actually scaled in for this second position. Once again, you guys can see
[43:51] my entire like top-down approach from the moment I entered a trade to the moment I get out of the this trade on my second channel Bread Trades, I literally there, right? You can see me enter this trade live on there itself. But yeah,
[44:05] trade recap. So, what happens is that after we got a bullish confirmation position right here. And then later on price pullback to this area here, giving me more confirmation. So, this is where I decided to scale in for my second
[44:19] position. And then later on uh like I said, I'm to this next 15-minute order block. So, that's why I targeted the area. And then my stop loss was below this new low right here that is has been formed here.
[44:33] You can see from price pullback it was this low here. So, my stop loss was situated at below this low here of my second position, right? The internal low that I've entered at. And then later on price just went up very, very nice.
[44:46] going to lie, right? But eventually price went up there slowly but surely and just hit TP. Right? But look at what price is doing. Price is just creating this is where when price was like reversing around here, I wasn't scared
[45:01] scared is because I trust structure, right? So, in this that low doesn't get taken out, then the bullish market structure is still intact and my trade idea is still correct. It is still valid. So, I will not get
[45:15] phased even though I'm down like 50k at the moment, I will just continue holding on to the trade idea. Because I understand market mechanics. TP, and I made a ton of money on that day itself.
[45:27] proud of because of the fact that I literally caught out the fact that I was going to get a sniper like trade and I did just that, that live trading recording, you will see that when I enter into this position
[45:43] here, I told you guys that I was going to get a sniper entry. And then right after I enter for the trade, price moved up immediately and then eventually went right? So, I told you guys I was I was going to do something and I ended up
[45:57] So, yeah. That's it. Right? So, basically just to sum up everything that we have covered in here
[46:10] always conflict with each other. They are just showing different layers Because whatever happens on a higher And you tend to see the same patterns across the different time frames.
[46:26] So, in this case daily time frame can be bullish. Right? Daily time frame can be bullish. In fact, it was bullish itself. In fact, it was bullish itself. But right now the 15-minute time frame
[46:38] time frame can be bullish. Each one of these time frame has a specific purpose as well. They are all serving a different role. time frame, which is king, right? The higher time frame is still king.
[46:53] So, they are all just like different little ants in a colony, just, you know, playing their part so that they can serve the entire kingdom or the colony. So, multi-time frame analysis is really just about using each time frame for a
[47:06] Once again, using the higher time frame to do this. Using the medium time frame to do this. Using the lower time frame to do this. picture. Medium time frame tells you where to enter, right? Develop your
[47:20] immediate trade idea, your immediate bias, and the point of interest. Lower bias, and the point of interest. Lower time frames tells you when to enter. Okay? So, I will say the higher time frame tell you
[47:32] what who is in control of price. Medium time frame tells you where to enter the trade. Lower time frame tells you when to enter for the trade itself. together, you stop getting lost in the noise and complexity of the market, and
[47:47] you start trading with much more clarity. little bit long, right? But because this is such a big, chunky topic that I have to spend more time covering. And I really hope that I've
[48:02] guys. Don't worry if you're still confused. As time passes, you will just get better at doing this. I will say when in doubt, just zoom out, right? So, what's the trend direction on the lower time frame
[48:16] always zoom back out to your higher time frame. Go back to the daily time frame. trading. Go back to the 1-hour if you're scalping. And then do your analysis from top-down. And when you do, you have a much more
[48:30] is actually doing. you guys have enjoyed this little episode for multi-time frame analysis. talk more about market mechanics concepts. And this is where
[48:44] foundation when it comes to market mechanics. Over the next few lessons, we're just strengthen that foundation and just make it even more robust, right? So, you can have a much better idea on how the market fundamentally
[48:58] So, with that being said I hope to see you guys on the next episode. And as always, remember you're just one trade away.


⚡ Saved you 0h 49m reading this? Transcribe any YouTube video for free — no signup needed.