[00:00]
your content for in 2026 and 2027, because as social media evolves, the platforms always kind of have to find new ways of identifying quality content
[00:12]
And turns out, there's actually a few moving parts of this that you can actually influence to get the Instagram algorithm on your side and break out with the I'll get that you ask.
[00:24]
of accounts, building their content strategy in different niches. And long story short, right now, the Instagram algorithm actually cares for
[00:38]
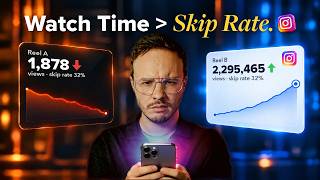
First of all, skip rate, but actually in a little bit of a different way that And then the second part is actually watch time, well, shares are the most important piece of this whole algorithm puzzle.
[00:54]
we'll get to what I actually found in my data about this in a second. but it's basically how well your hook worked, right? And right now there's pretty different conflicting information out there in
[01:10]
So I'm saying you need to hit 30 % or 30 % or less is the absolute best thing. That's what I hear regurgitated all the time.
[01:23]
And what actually matters way more is how your skip rate compares to your previous posts. Right. So if it's lower or higher than average and similar posts in
[01:35]
you're going to see right skip rate, for example, which is good because it's green, obviously. But here's where this whole thing gets kind of interesting,
[01:49]
because as low as possible can actually mean 50%, 55%. And across the board, if I had to name a number for thousands of breakout reels for my clients, the median skip rate of a breakout reel that kind of
[02:03]
is 45 % or lower. So it's kind of far from the 30%. Now, the best 10 % reels that I track in these outlier spectrums have a skip
[02:15]
But that's really just the best 10%. So you don't even want to aim for that because there's so many moving parts And that's where it's really important.
[02:27]
Skip rate alone has absolutely almost no correlation with how well your video is going to do. And this is where the second really important insight has unlocked for me in terms of looking at how the Instagram algorithm changed recently.
[02:39]
changed a lot previous to that. But like I said, how long people watch, AKA your actual average watch time And they actually go together in a very specific way.
[02:54]
But the number one metric that shows me whether a reel is going to break out and get a lot of views or not is actually whether it holds people past the And it doesn't matter whether the video is short,
[03:08]
like 10 seconds or long, like 90 seconds, because everything for some weird reason seems to get decided in that first five to 10 second window. well, you have to have good hooks and the skip rate and stuff like this.
[03:23]
Because if you have a low skip rate, aka a perfect hook, your reel is just not going to break out. in the DMs, for example, they're like, well, look at that,
[03:38]
I have a 29 % skip rate, for example, but it still doesn't work. Well, it's because it can hold people past the first five to ten second mark.
[03:51]
channel, obviously. One, for example, about pattern interrupts or what I call secondary hooks and Right. Obviously, this whole thing has a lot to do with storytelling,
[04:07]
the format that you use, but also structuring your script and opening loops But point being, and I've kind of noticed this sort of in my gut feeling from seeing hundreds of reels every single day, the hook is really not as important
[04:20]
Right. It still is important, of course, and Skip and Bread is important, but it's way more important to come up with something that people actually So the whole premise and the idea and the format are equally as important as
[04:34]
whether that's hot right now or not. If it's a really hot topic, cool story for my teenage years, or it's something that just people are dying to get the answer off,
[04:46]
right? And obviously then how you structure the first 10 seconds matter a lot too. And here's the data about this whole thing and what you need to hit in If people have a low skip rate, right, under 45 % and watch for more than 5
[05:04]
basically, most people doubled their views at least with this whole thing, right? Now, if you have a low skip rate, but people didn't stay, It doesn't break out and it's just a regular, usual view kind of thing.
[05:20]
Now, of course, if both suck, low skip rate, low view duration, well, you get it. The views drop quite a lot, actually, a lot. We're going to talk about this in a second.
[05:33]
Now, I'm pretty sure the smarty pants among us are like right now, shorter videos now because it's easier, obviously, right? Versus to hold them for 50 seconds in a 60 -second video.
[05:51]
And here's the other really interesting insight that I've noticed because it turns out there's actually different benchmarks based on a different reel length And this whole thing actually decreases quite a lot by the length that your
[06:06]
reels are. So if you have a shorter reel, you actually compete with a lot more shorter videos as most people post shorter videos. make a short video and hold people's attention with a short 10 second video,
[06:23]
what we have figured out is that you need to hit almost 100 % watch time in Now, if your reel is roughly 30 seconds long, which is like a number that a
[06:37]
but break out reel. usually at an average watch duration of about 8 to 11 seconds, still not that much, honestly, in addition to a good skip rate,
[06:52]
it gets even more interesting. The whole thing decreases quite a bit and turns out you just have to have people I'm not saying that's a good thing if you have people just watch a third of
[07:06]
it, but breakout reels between 30 and 60 seconds have between 13 and 17 seconds It's actually pretty easy, a lot easier, honestly, And for reels between 60 and 90 seconds, and honestly,
[07:20]
I think that's the sweet spot here because if we look at the data again among all the reels that we track that broke out the average watch duration of them was roughly 18 seconds you know of a 60 to 90 second reel now if you
[07:34]
look at longer reels like 90 seconds and over not every account has them already but some people do like two three minute reels and instagram usually says well we don't tend to show 90 second or longer reels to people my data actually
[07:48]
tells me exactly the Well, first of all, the benchmark rises a lot. So it seems like there's just a lot of the super great storytelling, So the average watch time you're supposed to hit in order to break out with
[08:01]
So that's quite a bit of a jump. by surprise, because Instagram says, well, we don't tend to show these long videos. 90 second reels and up broke out twice as much as everything else.
[08:16]
Now, don't think obviously that means that you're supposed to create 90 second first of all, demand for that right now, contrary to what Instagram says, because they're trying to have you stay with shorter videos.
[08:31]
And in certain niches, it makes a lot of sense to actually do that. That being said, length does not matter at all in terms of how many views something but you can also get away with lots of long stuff if you manage to hit these
[08:46]
can lift all of your views and make your content actually break out even more. And even if it does not necessarily hit these metrics that we just talked about. well, it's the most important thing.
[09:01]
And I kind of get why now, because what I've seen in my data is that with some really crazy share rate, you can actually get away with the worst video ever. But the point is stacking a great share rate on top of these already great
[09:17]
That's how you engineer consistent and predictable breakout videos, So what kind of share rate do you need to hit to get blessed by the algorithms?
[09:29]
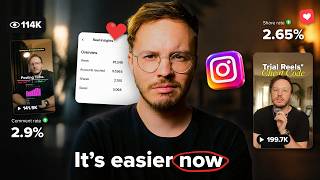
First of all, anything from 0 .5 % to 1 % is roughly average, especially if the other metrics are kind of average, If it's between 1 % and 2%, we can see actually a slight increase.
[09:44]
between 1 % and 1 .5%, 2%, right? Now here, by the way, we talk about actual value -based content, just funny memes and stuff like this, right?
[09:57]
So we're talking about serious creators if you're an expert or if you run a business or want to use Instagram in a meaningful way to get value across. But if you can, with all that said, hit 2%, that's usually when we see the
[10:13]
So, you know, 2 % to 3%, that's when stuff really starts to hit the fan, actually. And if you had 3 % and up, we actually see the algorithm
[10:25]
5 % is like that sweet spot gold rush metric. And you can have a horrible skip rate. if you had 5 % share rate, it's going to go haywire.
[10:40]
clarity thing from the other side. Because hitting those metrics that we just talked about is only one piece of And the other part of this whole thing is actually something not a lot of people
[10:54]
And Meta actually talked about this every once in a while they talk about this. And they're like, well, another important thing we look at in terms of the algorithm is we take a look at everything that's inside your reels,
[11:09]
So they're actually trying to guess the context, essentially. The reason for that is probably because there's just so much content and you just have to find out more and better sophisticated ways to actually
[11:23]
On the platform. That's kind of a hard thing to do. I kind of get it. And this is where we can see really sort of big changes right And then what's in your frame actually matters a hundred times more than hashtags
[11:40]
Both in good ways, but also in bad ways. And this is where we get into very, you have to be careful. Because like I said, the algorithm basically is just trying to match whatever
[11:52]
And if you hit the metrics from before, they basically make the algorithm understand, People behave in the way they're supposed to behave. But that only matters if the algorithm can actually find the right people.
[12:06]
And this is where this whole thing can really hurt you. For example, if you say terms that are not really clear for a specific target and that's equally as important or bad, if you have things in your frame that
[12:22]
Whether that is from a totally different niche, for example, something, or something that's potentially even against the terms of service, it says a word that kind of the algorithm says well this is sort of racy or
[12:40]
right here if you talk about or give examples that are from totally wrong niches so for example the other day i made a video here where i took apart a reel
[12:55]
of one of you and it was about power lifting right and the major problem that i found out with this reel was that there was not enough clarity for the algorithm, a technique or a term called tapering.
[13:10]
does with it, you can actually see there's a whole bunch of different niches Right. Tapering off off of antidepressants, for example,
[13:22]
And yes, I've seen the comment on this video from one of you guys who's like, is. So we got our clarity down and you know, we understand what's up,
[13:36]
They know instantly what's up, but unfortunately there's not enough clear cut And that's where it hurts you because like I said,
[13:48]
There's a lot of people talking about this all serving this term. So it just gets confused and it gets just diluting signals and it makes it harder for the audience to really identify and push it to the right target
[14:04]
right now. Let me give you another example, right? or even brands that are usually tied to a very specific audience,
[14:16]
Or let's say you have a book somewhere, right? In the mentorship, we recently had somebody talking about offline businesses, And suddenly they start to get a lot of comments and DMs from bookkeepers.
[14:31]
so much? So we took a look at it and turns out a lot of the content that actually broke out, he used an example, QuickBooks, because he was like,
[14:43]
right? They all have to deal with QuickBooks and that's how you can kind of It turns out, well, apparently QuickBooks, obviously it's related to bookkeepers and the algorithm just matches these two up and just shows it mostly to bookkeepers.
[14:59]
So yeah, even seemingly small things that you might not even think about can make or break your content strategy, especially if you've hit a plateau. I can't seem to figure out what really works here because I'm trying a lot
[15:13]
Sometimes the algorithm just hasn't enough clear cut data from you, right? So really get clear in terms of the words you say, Also, if you speak a little weird like me, it sometimes misrecognizes what
[15:31]
a lot of the time it actually recognizes the word hooks. For example, a lot of people have stuff about their hobbies and stuff like I used to have that a lot here on YouTube.
[15:47]
in the background. I'm like this looks cool You know I'm saying but on Instagram So let me match this up with guitar people and guess what?
[16:00]
It's gonna get shown to a lot of guitar people and you dilute the algorithm Things just get worse and then you feel like I don't know why I'm doing so So how do you actually know if the algorithm gets who your content is for?
[16:16]
Actually build a free tool for that, right? It goes through your recent reels, ask you a bunch of questions, Fix this first. Here's what you should do next, right?
[16:29]
All totally free. But even if all of this is dialed in, I found out another thing that more or less can quietly hold your whole account back. It actually has a lot to do with your category or tier,
[16:42]
right? It's not an official term, obviously, but basically the amount of trust Instagram has in you and you as an account, right? Because the algorithm's biggest enemy are spammers and low quality creators,
[16:57]
So if you say you do a lot of the things right and you're still stuck again at a certain plateau level, whether that's being stuck at 500 consistently or you notice, okay, I can't grow past 10 ,000 views or reach the right amount
[17:13]
of people, chances are you might've gotten hit with certain low trust score Some people might call this shadow bans, right? You know, it's like a complicated term, but here's where I actually have to
[17:27]
the head of Instagram's official statements about this whole shadow ban, actually, because Instagram usually says, well, yeah,
[17:39]
I was like, well, it does exist. Then they're like, well, it does exist, but you basically just need to look And if all is green there, you're not shadow banned.
[17:52]
If we take away reach, we'll tell you. And I have proof about that. it basically just means you don't have a hard ban or some hard policy violation.
[18:12]
That's it. But what you could still have is a low trust score because you were, or you've pivoted your content, or you've done something that kind of trips the algorithm up, even if you have some stuff in the background.
[18:26]
So you basically have to show Instagram that you're legit and that you're not a spammer and that you're a purposeful, a creator that is a net positive for the platform. and this is where the next test comes in which is something I've
[18:38]
never seen anybody talk about and it happens with trial reels actually. Now I'm sure you've heard this before in some shape or form but you're not supposed to post the same trial reel twice or let's say you're not supposed
[18:50]
to post a reel from your feet and then post the exact same thing to your trial reels right because you get usually hit with this pop -up saying well it's people, right? So don't do it.
[19:05]
And some accounts actually get hit with this even if they change a lot of things. and I still get the pop -up or sometimes you don't even get the pop -up. If your trial reels just get 100, 150, 200 views and they never seem to do
[19:21]
And at the other end of the spectrum, we actually have a lot of accounts and people saying that they get away with posting everything in trial reels. They can post literally the same thing to trial reels multiple times,
[19:35]
And that's great. And here's the thing, and I'm fairly certain from working that if your trust score is actually low, and unfortunately,
[19:47]
But if your trust score is low, they're more strict about trial reels, So we actually did a test with some of the people in the mentorship who've
[19:59]
had this pop -up a lot or who've had trial reels just being stuck all the time to make the algorithm basically understand, okay, And slowly, just after a few weeks of doing certain things,
[20:16]
slowly starts to, the reach slowly starts to increase and go up. We basically just run a bunch of tests and strategies about trial reels internally.
[20:30]
I'll talk about this in my next video. these, you might want to check out my mentorship where I personally work with
[20:42]
15 people a month in a very small, close group to help them actually build I'll see you in the next video.