
AI Summary
This video explains how to determine if a trading strategy is profitable using the expected value formula. The presenter, Rodríguez, founder of Hop Trader, introduces the two key metrics needed: win rate and risk-reward ratio, and demonstrates through examples how to calculate expected value to assess a strategy's potential profitability.
Chapters
The video introduces the expected value formula as a fundamental tool to determine if a trading strategy is potentially a winner or a loser.
The two main metrics needed are the win rate (percentage of winning trades) and the risk-reward ratio (average profit vs. average loss).
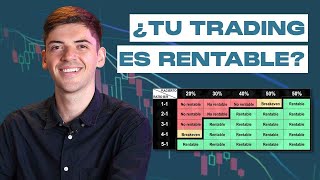
A strategy with a 30% win rate and 70% loss rate can still be profitable if the risk-reward ratio is favorable (e.g., winning 3x more than losing). Calculation: (0.30 * 3) - (0.70 * 1) = +0.20, indicating a positive expected value.
A strategy with a 70% win rate but losing 2x more than winning can still be profitable if the math works out: (0.70 * 1) - (0.30 * 2) = +0.10, showing positive expected value.
Trend-following strategies often have lower win rates but higher risk-reward ratios, while mean-reversion strategies may have higher win rates but lower risk-reward. Personal preference matters for psychological comfort.
Strategies sold online with 80-95% win rates may not be profitable if the risk-reward ratio is poor. Even a 90% win rate can lose money if losses are large.
1) Manual Excel tracking (time-consuming), 2) Trading live with a broker (risky), 3) Using algorithmic trading to backtest and extract metrics (recommended).
Programming an algorithm to backtest a strategy provides metrics like win rate and risk-reward ratio without risking capital, and offers additional metrics for deeper analysis.
The expected value calculation indicates potential profitability but does not account for operating costs, ROE tests, or in-depth metric analysis.
The expected value formula is a simple yet powerful way to assess a trading strategy's potential profitability by combining win rate and risk-reward ratio. Algorithmic trading offers the most efficient method to extract these metrics and evaluate strategies without risking capital.
Mentioned in this Video
Tutorial Checklist
Study Flashcards (7)
What are the two main metrics needed to calculate expected value?
easy
Click to reveal answer
What are the two main metrics needed to calculate expected value?
Win rate and risk-reward ratio.
00:40
How do you calculate expected value?
medium
Click to reveal answer
How do you calculate expected value?
Multiply the win rate by the average win, then subtract the loss rate multiplied by the average loss.
02:25
Can a strategy with a 30% win rate be profitable?
easy
Click to reveal answer
Can a strategy with a 30% win rate be profitable?
Yes, if the risk-reward ratio is favorable (e.g., winning 3x more than losing).
01:57
What is the risk-reward ratio?
easy
Click to reveal answer
What is the risk-reward ratio?
It measures how much you win on average when you win compared to how much you lose on average when you lose.
01:18
Why might a strategy with a 90% win rate still be unprofitable?
medium
Click to reveal answer
Why might a strategy with a 90% win rate still be unprofitable?
If the average loss is much larger than the average win, the expected value can be negative.
06:29
What is the recommended method to analyze a strategy's metrics?
medium
Click to reveal answer
What is the recommended method to analyze a strategy's metrics?
Using algorithmic trading to backtest the strategy and extract metrics without risking capital.
08:36
What does a positive expected value indicate?
easy
Click to reveal answer
What does a positive expected value indicate?
The strategy is potentially profitable over many trades.
03:04
💡 Key Takeaways
Low Win Rate Can Still Be Profitable
Challenges the common misconception that a high win rate is necessary for profitability.
01:57High Win Rate Strategies Often Sold Online Are Misleading
Warns against strategies with 80-95% win rates that may have poor risk-reward ratios.
06:01Algorithmic Trading as the Best Analysis Method
Highlights the efficiency and safety of using algorithms to backtest strategies.
08:36Potential Profitability Disclaimer
Emphasizes that expected value does not account for costs or in-depth testing.
09:28Full Transcript
[00:01] This exists; it's called the expected value formula, and today we're going to see strategies. Pay attention because what we're going to see today is fundamental to knowing if your strategy is potentially a winner or a loser. Hello everyone, and
[00:14] algorithmic trading ranking video from scratch. I'm the author, Rodríguez, founder of Hop Trader, and I've been algorithmic trading for years, which is basically the mix of programming and know more about what algorithmic trading is, you can click here;
[00:27] what it is in depth. But anyway, this time we're going to answer the we know if a strategy is a winner or a loser? And second, is there a formula to know this? The answer is yes, we need to use the
[00:40] need to know are the metrics of the strategy we want to analyze. But metrics? Well, metrics are the final result that our strategy gives us operations we perform, but in this case, for the
[00:53] the two main metrics: the win rate and the risk-reward ratio. Now, what does the win rate mean? It means how many times we are wrong. For example, we can have
[01:06] a strategy with a 40% win rate, which would mean that out of every 10 trades we make, we will win four and lose six. Therefore, we will have a 40% win rate in that
[01:18] trades we make, we look at how many times we win and how many times we lose, and based on that, we calculate the percentage of wins we had in we have the risk- reward ratio, which simply means
[01:31] how much we win when we win and how much we lose when we lose. That is, of the before, we have some trades that we win and lose. What we will look at in the risk-reward ratio is the number of times we win, how many times we lose, and how many times we lose.
[01:44] the risk-reward ratio is the number of times we win, how many times we lose, and how many times we lose. more depth, let's look at some examples. In this case, we'll use an positive expected value. What does this mean? It means that the strategy is
[01:57] 're analyzing. This strategy with a positive expected value has a 30% success rate and a 70% failure rate. But you might ask, winning strategy if it's only right 30% of the time? The answer in this
[02:11] case lies in the risk-reward ratio, that is, how much we win when we win and In this example, imagine that 30% of the time we win, we win $, and the other 70% of the time we lose, we lose $. This
[02:25] means that for every win we have, we win three times more So, continuing with our example, what we should do is multiply the 30% of the times we win by three, which is the average profit we
[02:38] have. To that, we should do that internal calculation. We should subtract multiplied by our average loss, which in this case would be 70% of the loss multiplied by 1. So, in this way, we would get 30 *
[02:52] 3, which gives us 90. And from that, we will subtract 70 * 1, which gives us 70. Now, if we do 90 - 70, we would get a final result of plus 20. But what does this mean? Well, on the
[03:04] has a positive expected value because the final result it gives us is positive and not negative. It also tells us that over 100 trades, we will normally have a profit of $, taking into
[03:16] when we win, and Now, this example we are seeing here is so that you can see that even if we have a strategy that is only correct 30% of
[03:28] the time, or 40% of the time, or 20% of the time It can also be a positive strategy, even though it has a success rate of less than 50%, meaning it's right less than half the time. Why? Because when we win,
[03:41] Now, the same can happen in reverse. Imagine we have a strategy with a 70% success rate, meaning that out of every 10 and lose three. Now imagine that in this
[03:54] we win $ and when we lose, we lose $2. So, in this case, twice what we win. But that's not necessarily bad either, Again, to know if this strategy is profitable or not, we should
[04:10] which in this case would be the same: take the probability of winning, which in this case is 70%, multiplied by the average profit, which in this case is $. This calculation would give us $7, and from this, we must
[04:24] subtract the probability of losing, which would be 30%. Multiplied by our average loss, which in this case would be $2, the probability of winning multiplied by the average gain would give us $70. From this, we should subtract
[04:36] by the average loss, which in this case would give us $60. As you can see, the is telling us that this strategy is also profitable, even though it works clarify that this is simply to explain the expected value formula,
[04:52] operating costs we have when trading with the broker. work exactly the same way for the expected value calculator, One strategy has a lower success rate, but when it wins, it
[05:07] wins more. On the other hand, we have a strategy that is right many times, but loses. Generally, trend-following strategies tend to be like a lower success rate, but when they
[05:19] win, they win much more than they lose. And
[05:31] operating that strategy. For example, if you do n't like losing many times in a row, I would an anti-endomissium strategy [Music].
[06:01] the risk-reward ratio, which means how much we win when we win Why? Because what's usually sold online, unfortunately, are strategies seem like the best strategy in the world, for example,
[06:16] strategies with 80, 90, or even 95% win rates. At first, we might think it's most of the time, expected value calculator, that's not necessarily the case. Even if we're right 90% of the
[06:29] time, when we win, we win $100, and when we lose, we lose $100. Even if we win 0% of the time, when we lose those 10 times, won when we won, and more. Therefore, it's
[06:42] win rate, but we should also consider the risk-reward ratio to This way, we can determine if the strategy has a positive or positive expected value means the strategy is potentially
[06:57] negative expected value means it's unfortunately not disclaimer: all we're doing here is analyzing the We're not including operating costs, and
[07:12] this doesn't necessarily tell us if the strategy will work this way in the we're simply determining if our potentially profitable or losing. You might be wondering
[07:25] analyze our strategy. Well, there are three options, and I personally believe the last one is the best. We could open an Excel spreadsheet and made by our strategy over time, but the problem with that is we'd have to do it
[07:38] a chart and see which trades were winning and which were losing, and based on that, we would calculate the... What is the win rate? And how much do lose when we lose? Basically, what we need for the expected value calculator.
[07:51] this is that we would have to do it manually, and we would spend a lot of time those metrics. So it wouldn't make much sense to do it this way since we would the second option is to go directly to the broker, go to the market, and trade our
[08:07] are making the trades, the broker itself (depending on which one, but almost all of them have it) will tell us what win rate we have, how much we win when we lose. But here another problem arises: we would be putting into operation
[08:21] has a positive or risking our money without knowing exactly if our strategy is recommend this either. And finally, we have the third option, which is to use
[08:36] algorithmic trading. We don't need to fill out an Excel spreadsheet, nor do we need to risk our money. The only thing we need is to learn to program worked in the past. So we We program an algorithm, input it
[08:49] directly into the chart we want to analyze, and the algorithm itself we need. And note that this does n't just give us the success rate and risk-reward ratio metrics; it also gives us many other metrics
[09:02] that we can analyze to determine if the strategy is good or not. We'll what we're interested in extracting from the algorithm here are the success rate and the risk-reward ratio. We'll take these metrics,
[09:15] will give us the final result to determine if the strategy has a positive or negative expected value. So, tells us if our strategy is potentially profitable or
[09:28] not. And note that we're saying " potentially profitable" here because we're operating costs, nor are we performing ROE tests or in-depth metric analysis. We strategy has a success rate of
[09:41] less than 50%, it doesn't necessarily mean it's a bad strategy, as long as it risk-reward ratio compared to the success rate. Keep in mind that we do manually; we can do it through algorithmic trading. This
[09:55] these metrics provided directly by the software where we we would have to do to extract these metrics is program the code we want to display on the chart
[10:09] This is obviously much simpler Excel spreadsheet or applying the strategy directly with the broker, risking our money without knowing if the strategy has a
[10:21] hope you enjoyed this video where we explained how the expected value calculator works. Here's a series interesting. Thank you for watching until the end, and don't forget to
[10:33] turn on notifications, and all that stuff you already know. See you in the interesting concepts about algorithmic trading. Bye bye!