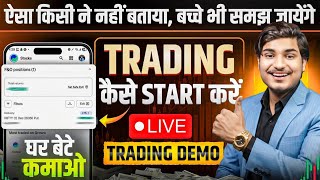

Trading Basics: Buy Low, Sell High
45sClear, simple explanation of trading fundamentals appeals to beginners and is easily shareable.
▶ Play Clip"Title accurately promises a beginner's guide to trading, and the video delivers comprehensive basics."
This video is a comprehensive beginner's guide to trading in the Indian stock market, covering intraday, delivery, and options trading. The presenter explains key concepts like candlestick patterns, indicators, and how to use trading platforms like Zerodha. The goal is to teach viewers how to start trading from scratch.
Trading is buying low and selling high to make a profit. Example: buying an item for ₹100 and selling at ₹150 yields ₹50 profit.
Three main markets: Indian stock market (NSE/BSE), Forex (foreign currency), and Crypto (digital currency).
Intraday (buy and sell same day), Delivery (long-term investment), and Options trading.
Market opens at 9:15 AM and closes at 3:30 PM. Trading is only possible during these hours.
Popular brokers include Zerodha and Angel One. Angel One is recommended for beginners due to low annual charges and brokerage fees.
Nifty (top 50 companies), Sensex (top 30), and Bank Nifty (top 12 banking stocks) are key indices to track market performance.
Use filters to see gainers/losers by market cap (large, mid, small cap) to identify profitable stocks.
Use the search function to find specific companies (e.g., Adani, Tata) and view their current price and return percentage.
View open price, previous close, buy/sell quantities, average traded price, volume, 52-week high/low, and LCL/UCL limits.
Indicators like RSI, MFI, and MACD help analyze market trends. RSI below 30 indicates oversold, above 70 indicates overbought.
Delivery: buy and hold for long term. Intraday: buy and sell same day; margin of 5x leverage is available.
Intraday offers 5x leverage, which amplifies both profits and losses. Example: ₹20 investment can yield 50% profit or loss.
Set stop loss to automatically sell if price drops to a certain level, and target to sell at a desired profit price.
₹20 charge per trade for intraday/delivery. Ensure profit exceeds charges to avoid net loss.
Options trading involves buying premiums (contracts) that derive value from underlying assets like Nifty. High volatility allows quick profits but also high losses.
Nifty is recommended for beginners due to lower margin and less fluctuation. Access via FNO section in trading app.
Green candle: price increasing (bullish). Red candle: price decreasing (bearish). Support and resistance levels help predict trends.
Charts can be viewed in different intervals (1 min, 5 min, etc.). Sideways market means price is moving within a range without clear trend.
RSI indicates overbought/oversold conditions. EMA (Exponential Moving Average) shows trend direction: price above EMA is bullish, below is bearish.
Super Trend shows red line for downtrend and green line for uptrend. It helps confirm market direction.
Option chain displays premiums for different strike prices. Premiums decrease as expiry approaches (time decay).
Buy call option if market is expected to rise; buy put option if market is expected to fall. Profit when market moves in expected direction.
ATM (At The Money): strike price near current price. ITM (In The Money): profitable if exercised. OTM (Out of The Money): not profitable currently.
Based on chart analysis, decide to buy call or put. Choose strike price (OTM recommended for beginners). Set stop loss and target.
Track profit/loss in positions. Use stop loss to limit losses. Exit when target is hit or to avoid time decay losses.
₹40 charge per options trade. Ensure profit exceeds ₹40 before exiting.
This video covers the basics of trading in the Indian stock market, including intraday, delivery, and options trading. Beginners are encouraged to start with Nifty options and use technical indicators to make informed decisions.
What are the three main types of trading markets mentioned?
Indian stock market, Forex, and Crypto.
00:28
What are the trading hours of the Indian stock market?
9:15 AM to 3:30 PM.
02:19
What is the difference between delivery and intraday trading?
Delivery is long-term investment; intraday requires buying and selling the same day.
08:32
What leverage is typically offered for intraday trading?
5x margin.
09:28
What does RSI below 30 indicate?
The market is oversold and may go up.
16:16
What does a green candle represent in candlestick charts?
Price is increasing (bullish).
14:15
What is the brokerage charge per trade for intraday/delivery?
₹20.
11:44
What is the brokerage charge per options trade?
₹40.
23:33
What does ATM stand for in options trading?
At The Money – strike price near current market price.
19:38
Why do option premiums decrease as expiry approaches?
Due to time decay.
18:45
Definition of Trading
Fundamental concept for beginners: buy low, sell high.
00:01Broker Recommendation
Practical advice on choosing a broker with low charges.
02:33Intraday Leverage and Risk
Explains 5x margin and its impact on profit/loss.
09:28RSI Indicator Interpretation
Key technical analysis tool for identifying overbought/oversold conditions.
16:16ATM, ITM, OTM Explained
Clarifies important options trading terminology for beginners.
19:38[00:01] how to trade. But first of all you people have to understand what is trading? So you people buy any thing at a low price and when its price increases, you Now suppose you bought any item for ₹100. Now when its price increased to Rs 150.
[00:15] Then you sold it. So you made a profit of ₹50 which you made friends, when we do online trading, you get many options in the market. can do online trading. First, you can trade in the Indian stock market.
[00:28] Where many companies are listed on NSE and BSE exchanges. doing well and you buy its shares. That means you people buy shares. Now let us assume that you bought a share for ₹100. Now the company is moving forward. It is
[00:42] obviously the price of Guys shares also keeps increasing. Let's assume it becomes 150. Then you sold it. So you made a profit of ₹50 which you made by trading in the Indian stock market. can do Forex trading here. Where you people buy foreign currency. For example, suppose
[00:56] if you had purchased $1 in the previous year, the price at that time would have been ₹85. But friends, today on the current date the price of $1 has become ₹95. That means you can do crypto trading where you buy digital currency. Like
[01:10] many such new coins also come. The demand for the coin you buy increases, the Guice rate also increases. When the rate increases, you sell and today I am going to teach you
[01:26] your intra trading, there is delivery trading, there is option trading. trading, there is option trading. will explain everything to you in basic terms and teach you in simple language. And it is not like that, I will
[01:39] Brother, I have taught you everything in depth. If you are a beginner, part-time student, you want to start trading. This video Like this is our candlestick pattern, what is the red candle?
[01:53] What is a green candle? How do we install indicators? This is our option chain chart, You will get everything in one video. Just watch it completely. But would request you to subscribe brother because we bring you such
[02:06] of cost and teach you trading absolutely free of cost. start the video. Now friends, we have to trade in the Indian stock market. So first of all you people have to understand
[02:19] Indian stock market opens at 9:15 am in the morning and closes at 3:30 pm. able to trade and the rest of the time our market remains closed and friends, let's talk about where you will trade if you want to trade in the Indian stock market
[02:33] ? Friends, you find many such brokers in the market. , Zerodha. Where you open your demat account. That means you you open a bank account, your trading account is also opened in the same way.
[02:47] use the funds for trading. Now whatever funds are there in your demat account, Now let's talk about which is the best broker? Now see friends, if an annual charge is deducted from you, that is, an annual charge
[03:02] Friends, that seems like jail to me. Secondly, your brokerage is charged on every trade. That means there is a charge. So Jel One only and personally guys, I use this only. I am giving you its link in the
[03:15] clicking on it, you can open your demat account inside Jail One. If you don't know, you will You can learn by watching that video. Rest of the friends, as soon as you you will get such an interface here. Now look, we are in the stock section
[03:30] see Nifi on Market Today. This means that the top 50 companies in India come under NIFI and here you are seeing this point of NIFI, 2587, friends, this is a reference point of 50 companies.
[03:43] This shows how the 50 companies are doing all over. So here you will see that 0.05% is currently going down because it is in minus. So in this way you Rest of the friends, Sensex means that the top 30 companies coming in India become
[03:57] Sensex. Friends, the top 12 banking come under Bank Nifty. And look, we call this indices. Nifty is our index. Sussex is our index. Bank Nifty is our index. Well, there are many other
[04:10] As you guys can see. Now guys, if you come down a little here, you will see Top Movers, click on View All. Friends, look here, I am selected on gainers and selected on large cap. That means friends,
[04:22] here you can see who is making profit on the biggest companies. You can see and here you will see what is the price of a share and what percentage return it is giving here. Ok Rest, if we select mid cap then
[04:39] friends, you will see who is making gains in them. Well, if you people select the losers here who is making losses in big companies? Who is making losses on mid cap? Who is losing money on small caps ? In this way, you can get complete knowledge here by applying filters. Now let's come back here.
[04:53] Now let's assume guys that you know about a company. And you will buy its shares. If the company grows, the share price will increase and you will benefit. So simply you will get this search button here.
[05:06] I searched Adani here and you can see that I got to searched Adani here and you can see that I got to what is the price of one share here ? 141 and here below you will
[05:20] see how much percentage of return it is giving. So right now it is in minus. So in this way you have to do here is click on the search button. Whatever company, like here there is Tata company, then You will be able to see all the stocks of Tata here. Now, there
[05:34] guys will come up here. Look, it's nifty here. click on this. Now friends, let's move on to stocks here. So you guys will see which companies are there. And here on the side you will get to see the share price
[05:48] it giving returns? Now let us assume that I want to buy shares of HDFC Bank. That means you have to look here, HDFC Bank is visible, tap on it. I will swipe up. This you will be able to see at
[06:02] what price our market opened. how much was taken? At what price did the market close previously ? Now friends, below that you will see quantity and buy price.
[06:15] no need to get confused in this. It is very simple. Like in buy price, look at this price showing and giving you an overview that at which price segment and As you can see, people are buying in such quantity at this price.
[06:29] People are buying in such quantity at this price segment. So this shows you and this is the sale price. The red that is visible in this. Now friends, here you also get to see the average traded price, that is, at
[06:45] people are trading here, that is, whether they are buying or selling. Rest you also see the volume. Volume means how many people are buying and also get to see the data of 52 weeks that
[07:00] how much did it go? So brother 1020 had gone. You guys also get to see LCL and UCL. This means lower limit upper limit. Look, the meaning of lower limit is that 885 is the lower limit. Meaning, if the price of this share, which is currently running at 981,
[07:13] falls, then how much will it fall? So it will go up to 885 and will not go beyond that. Rest of the friends, if it goes high then how much will it go? 1082 will go. We call this the upper limit. The price of this head will go up that much and will not go any higher than that. So you
[07:25] guys get the complete overview here. Rest of the friends, if you write in this way then that what is the graph going on here within one week. Friends, what Look, within one week it is going down completely. You can see this as per one day,
[07:38] here the bit is giving you green signal. Rest of the friends, if you click on technical then to see many indicators. There is RSI, there is MFI, there is MSCD. So this will be a little detailed. We will talk about this further. If you click on the remaining derivatives, then in this
[07:51] And here you will get to see the fundamentals that what is PE ratio? What is the price to book ratio? What is PE ratio? What is ROE? So in this Now let's click on the Overview button again. Now you have a complete overview.
[08:05] So in this way you have to understand any stock very well that yes brother, it will be not. After understanding, friends, here you will see a buy button. friends, you will see that there is a sale
[08:18] not necessary that you have bought it first only then you will be able to sell it. Friends, you will intraday. If you want to invest for the long term, then you will buy here first. After that, when you feel that you are profitable then you
[08:32] we will explain it to you people in detail. As if I have to accept that I have to say goodbye. people are getting the option of delivery and you are getting intraday option. Now what is this delivery? Friends, delivery means that you bought it today and
[08:47] friends, you can sell these futures anytime. Like today I have bought it and when I will be profitable and when it will give me good returns. So this is investment, you have invested. You bought a stake in a smaller company.
[09:00] intraday that you bought it today and you will have to sell it today itself. If you do not sell, the sale will happen automatically before the market closes. So this what is the difference friends? If you guys assume that it is in delivery, then I will
[09:14] Ok? So here you guys will see how much I am looking ? Margin required seems to be 986. Ok? Now friends, we will buy one share intraday. So look here, how much does it cost? It looks like 197. So how did it decrease? So
[09:28] friends, in intraday you get to see a margin of 5x. That means you get leverage. I will explain to you how there is harm and benefit in this. For example, let's assume that the Friends, how much did you buy it intraday? For ₹20. Now friends, what happened was that the company made a
[09:44] profit. Its share price increased to ₹110. So friends, if you had bought it for ₹20 then your money became ₹30. That means you got a profit of 50%. But friends, the company incurs price becomes 90. So friends, if you had bought it for Rs 20 then your money will directly become Rs 10. That
[09:58] means there will be a loss of 50%. So this is intraday friends. Within this, people are assume that I have to buy on intraday only and I have to buy five shares. margin I am applying here. Now after that you have to buy at the market price or
[10:12] you have to put a limit. What does limit mean ? Right now the price is 980 brother. But I want to do it after it reduces to 970. So I can place my order by clicking on Place by Order here. When this price of mine matches that of our share, then it will
[10:25] automatically be executed here. But friends, if this price does what will we do? We buy at market price only. And friends, here And here you will get the confirm button. You have to click on this. Friends, it will be
[10:39] Now friends, here you can see whether you are getting any benefit. Are you suffering going into plus. So in this way, now you also friends, it is possible that you have taken a trade here. You went on a trip after that. Then you see after
[10:53] opening it now friend I went to loss. So you get the feature. You just tap on it. You will get the option of stop loss. Click on it. Now friends, the price here is currently 980. But you want that brother, if its price
[11:05] becomes 970 then it should be automatically sold here. I will not bear much loss. So you guys can place the order. Rest of the friends, you also get the option of target that currently the price here is 980. When I want it to become 990 then
[11:17] my automatic sale should happen here. So in this way you will click on Place Sale Order. Please Friends, whenever your order matches, your sale will automatically take place here. Let's click on positions. Can you see now whether we are making profit or loss here?
[11:30] Now let us assume that we have to exit i.e. sell. We have getting the Exit at Market button. Click on this. Click on confirm. executed. We took exit here. That means we have made the sale. And
[11:44] friends, your charge is deducted on every trade. How much does it cost brother? ₹20 is deducted. Meaning friends, let's assume that you made a profit of ₹10 and you took exit, then brother, your charge of ₹20 will be deducted. Still you people will be in loss.
[11:58] how you should do intra trading and how you should do delivery trading. Now I am going to teach you as much as you watch this reel, you will find many such influencers who
[12:11] and they share their PNL saying that brother, I have done so much and so much in one day. They ? Friends, those people also do options and trading. Because trade on intraday and delivery, then how much will the share of any company increase in a day? ₹1 will increase by ₹2 or
[12:26] not be that much profit or loss here. But friends, this thing is possible in option trading. get market volatility. Like friends, this is your graph and you bought it here and up. Then you people will sell it here and you will get profit. But if you do
[12:41] graph goes down, then you suffer huge losses. So, where your market is volatile, you can make quick profits and trading. Now friends, what do we do in option trading
[12:53] buy premium. What is premium? Do you buy a contract knowing like a market has a price. You felt that its price would go up now. So you have bought a premium where the
[13:08] But right now you did not feel that the price will also fall, that is, it will go down, so where when the market price falls, the price of that premium increases. When profit. Now look, you people might not be able to understand what premium is,
[13:22] you people will understand, now you people can do option trading on stocks, we have Nifty 50, Bank Nifty, Sussex, we are showing you within Nifty 50 is perfect for beginners because here you people have to pay less margin and
[13:36] you also get less fluctuation, so friends, let us click here on Nifty 50. come to the home page here. Here you will get the option FNO, you have to click on it. So here you will see Nifty Sussex Bank Nifty. So
[13:49] you guys trade on indices. As I told you, here you do beginners here trade within Nifty. Do options trading. So we will click on Nifty on that. Then friends, you will
[14:01] get the option here by making a chart. You have to click on this. Now friends, here candle. This is a red candle. What does it mean ? So first of all let me tell you, look, you have to make it smaller using this method. Have to make it bigger. This zoom zoom out and this left and right.
[14:15] You can do it this way. Look friends, whenever your green candle is formed, price of Nifty is increasing and when friends, it shows a red candle, it means that the market price is going down, it is falling,
[14:28] so in this way there is a green candle and a red candle, now here you people understand that and it fell, it went down in this way, so we call it down trend or bearish, okay, we use two words, down trend or bearish, friends, here we will
[14:42] see that the market was here just now and it went up in this way, so we call it up trend and we call it bullish. Ok? Bullish means the market is going down here. So in this way there are some words which I have
[14:55] of trading. And let me tell you here, look, the market had just gone down a lot. So we call this support. How low did the market go? The one who goes to the bottom, we call him support here. Ok? And what went to the top is what we call
[15:08] analyze. So you guys can see the graph here in this way, how resistance friends and if it has gone up then this will also become our resistance two. So you can do it here in this way. Now let me tell you here that this candle that is being formed is being
[15:21] formed in an interval of 1 minute. Now if we remove this and make it 5 minutes here, then how the market is moving in 5 minutes. formed in an interval of 5 minutes. So you can check it in this way. If
[15:35] fully understand how the market is moving overall here. Now you will see that your market is being developed in this manner here. So we call it moving sideways, the market is neither going up much
[15:48] now friends, let us do this again here for 1 minute. Now here how will we know So a lot of things happen guys. Like you guys, we read this candle that is being formed and friends, we also do technical analysis. So
[16:02] FX button, click on it. A lot of your technical analysis happens here. Like this is your relative strength index. We will So here you will see that you are seeing a number 46.
[16:16] Understand what this means. Like let's say it was 30 right now. Ok? So this means it has been oversold. Meaning a lot has been sold. If it is bought now, the market will go up now. This is indicating to us. Now let's assume guys it is 70 right now.
[16:28] A lot of money has been spent. If it is sold now, the market will go down here. So this is an remove this. To remove, click on the delete button and remove Click on FX and apply another indicator. So we will click on Moving Average Exponential
[16:44] Look, here you will see a blue line. So friends, whenever and the price of Nifi is going down. This means that the market will go down. Friends, when the blue line is down and the market price is up, then
[16:58] market will go up, but right now it is indicating that the market is going to go down, and after that we remove it again, click on FX, and there are many more I teach you, let's say Super Trend, click on it,
[17:12] see two lines, one is your red line and the other is your green line. Look friends, whenever this red line is formed, it means that the market will go down is formed, it means that the market can go up now. As you can
[17:25] red line was indicated here, the market really went down and when this green up in this manner. So this is how the red line indicates the green line. Now A detailed video can be made regarding this. We won't go into much detail right now.
[17:40] Now let me teach you guys. Let's assume you have understood how to or down. However, friends, nothing is confirmed. Only you guys 1 minute, we are seeing that the market is going up. You
[17:53] can see a green candle being formed here. So brother, what should we do to get benefit? So friends, here you will simply get the option by chaining an option. You have to getting such an interface here. So there is no need to get confused. It is very simple. First of all,
[18:05] seeing this expiry. Ok? So friends, this is the option chain of expiry. As you guys can see. prices that you are seeing here and the prices that you are seeing here,
[18:19] ? Now you guys see here what is its price? 61 is going on. Ok ? Now we make its expiry here on 30th December. So friends, you will see that our price will increase. So guys, let's come back to the
[18:32] same position here. Yes sir. Come on guys, as you can see, its price here was 61. Here you have reached 106. So look here it has increased. So what did I tell you? Its price decreases. Why does it decrease? Let me explain this to you.
[18:45] on expiry. Now friends, this decreases because as your expiry closes, as the date closes, the premium price that you are gradually decreases. This means that if you have purchased this premium and
[18:58] your expiry is nearing, then you will still incur a loss. So, you have to sell here first. This is what it means and whatever prices you see here, premium. Ok? Is. As I told you, here you buy premium, so
[19:10] here you buy the price and as the market goes up and down, yours can see that it is increasing and decreasing. Now friends, as I told you that the to get profit. So friends, if we
[19:25] profit here. Friends, if the market had gone down, if we had bought put option here, we would have made profit. So this is how it is done friends. Now there are a So brother, if we buy which one here, we will get benefit here. First of all you guys should
[19:38] this is our ATM at the money ATM, right now you guys see the current price of Nifi is ₹25800, look above that, the price has decreased, look above that, it has decreased by 50, so after achieving all this price, friends, it has
[19:54] reached here, so according to call option, friends, this is our ITM in the money, okay, and friends, let us show you guys here that this price is running right now, above that you guys will see that it has increased by 50, it has increased by 50, it has increased by 50, so this is our price going to achieve.
[20:07] So friends, according to this call option, it becomes OTM out of the money. But friends, according to put option, it is the opposite. According to put option, the one here here friends is in the money. Got it? Now friends,
[20:20] why did I tell this? Because all the beginners, friends, they trade on OTM. As you guys can see. Or friends, that is add the money, all the seeing around it, those people buy them here. So now you guys understand which one
[20:34] market is open again, what will we do here ? Click on the chart button So the market is going up brother. So here we have to buy call option. Look, the market has gone down this way. So I feel like Enough has gone up. It could go
[20:47] So I have clicked on option chain. Now in this way friends, only we nearby people say goodbye here. But friends, you will see that this is a bit expensive. Is 74. So I'm short on funds, so we'll go upstairs and buy 20. So
[21:00] understand? You guys can buy anyone here out of the money. But friends, buy the one that is far away. But the one far away is not as much fun as the one near. we can buy here but in In the Money it
[21:14] requires a lot of funds and your fluctuation is high on it, so the loss and profit happens fast, so it is not right for beginners, so what will we do, let's say we buy the one which is here, then we will tap on it here and friends, here we can
[21:27] buy it, but now you will see that there is a sell button here too, so friends, if you sell the put option then the opposite happens. Friends, bye here. Clicked on the buy button.
[21:40] button. That means you bought it today. If you are not profitable today, as the expiry closes, the price of this premium also decreases. You have to keep this in mind also. Ok? And here if you buy in lots then you have to buy in 75 lots.
[21:56] buying even one lot, then friends, you can see how much available margin is low, so we buy the lower one here. So let's come back brother. Come on guys, let's buy some of the faraway ones here. Let us buy the one for Rs 11 here
[22:09] And here we have to buy one lot here. We have been selected. So seems to be 973. And here also friends, you can set whether to put a limit. Come on guys, let us buy here at the market price and
[22:23] confirm by clicking on Place Buy Order. Now guys, you will see that our click on the remaining positions. So here we will start seeing whether we are getting profit or loss. Okay, now as you can see, our 1
[22:36] friends, look at us, we will start incurring losses here. As it goes down, assume here that you guys don't have to suffer much loss. So you can place stop loss in this also. button. Click on this. Like right now the premium price is ₹11. What
[22:51] I want here is that when this decreases to ₹8, my sale should happen automatically. set targets. Target like ₹12 is running here right now. I want that when it increases to ₹15, my sale should happen automatically.
[23:04] When it matches, ours will be executed. Friends, by Okay, as you can see friends, how much is happening here right now. see that we are currently making profits here. So you people also have to learn and do it
[23:18] So friends, you have a lot of volatility in options trading. So the price will increase and decrease rapidly. So you may suffer loss as well as profit. And friends, your charge is deducted here on every trade of ₹40. So friends, you should not take exit until you are
[23:33] making a profit of more than ₹40. Click on this and click on confirm. Friends, you have how much we have made here. So friends, in this way you have to do option
[23:46] And friends, here I can also see that I had bought the put option of Nifty for ₹25,500 on 23rd December. So once again let us click here on option chain. So I bought this one here for ₹25,500. As
[24:00] price of this premium increases, my profit increases. Or I would have sold it, that's what you have to do option trading here. Now friends, I tried to tell you a lot about trading in just one video and I did tell you. All the basics must have become
[24:14] you still have a lot to learn. So brother, keep subscribing to the channel because in the Rest of the friends please subscribe to the channel. See you in such new videos. Till then , keep watching to see Hrithik and bye-bye.




⚡ Saved you 0h 24m reading this? Transcribe any YouTube video for free — no signup needed.