[00:01]
breakout strategy for the last 6 months and I've made steady profits with it. The strategy is simple, but there are many different versions of it online. One variant that I see over and over again is using the orb with a breakout,
[00:14]
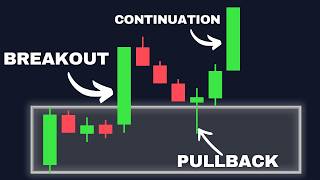
pullback, and continuation pattern. It looks like a really good setup, but the only way to know if it works is to try it out. I have back tested 5 years of S&P 500 data to find out for myself. But first, I'm just going to do a quick
[00:27]
strategy for anyone who's new to the channel. This is a 15minute opening range breakout. I'm here on a 15-minute chart, and I set my time zone to New York. So, that's UTC minus 4. I then look for the 9:30 candle, which is the
[00:42]
market open in New York, and that's this green candle here. Once I've got that, I'm going to mark out the high and the low. So, I mark the high and then do the same thing with the low. This gives me my opening range. After that, I'm just
[00:54]
through this range. There are different ways to do this, and I know that some people will enter as soon as the price is broken, like on this green wick up candle to actually break through and then close above. So, in this case, my
[01:08]
signal is this candle here because it's the first one to actually break out and then close outside of that range. I then enter at the open of the next one. So, this here would be my entry. And I'll place my long entry here just to
[01:20]
visualize things a little bit. After that, the stop loss goes at the bottom of the range. So down here, and I target 1.5 to one reward to risk. So this And this would have been a profitable trade. There are additional rules that
[01:34]
I've developed like I don't trade after the 12:00 candle, which would be here. So that would be my cut off for entering a trade. And I also don't trade ranges that are either too small or too big based on the recent ATR. I'm not going
[01:46]
I'll leave a link to the detailed video show the back test as well. The problem with this approach becomes apparent on this trade. I've got my 50-minute opening range marked by this first green
[02:00]
candle, and then I have my breakout, but the breakout is so big that my entry ends up being all the way out here. That in turn leads me to have a really big stop-loss on my trade because I place the stop at the bottom of the range. But
[02:12]
initial breakout is that we get this pullback towards the opening range. This First, I switch over to the 5-minut action a lot quicker. My orb range is
[02:26]
still defined by the first 15 minutes of the day. But since I'm on the 5-minut time frame now, I have to use the first three candles to define my range high defined, I then wait for my breakout just like before. But this time, I don't
[02:39]
buy immediately on the close of this breakout candle. Instead, I have to wait and see if price is going to make a pullback towards the opening range. And because I'll be getting FOMO about missing out on a potential trade,
[02:52]
way. But according to this strategy, price will often make a pullback and it will return back to the orb. And what I'm looking for is a candle that's going close back above it, which is exactly what this candle here has done. The
[03:06]
reason for this is that I want to see buyers coming back in and pushing the confirmation that this line is now starting to act as support. Once I get immediately. I want to see confirmation that price is going to bounce off and
[03:20]
move back up. And I'm going to be waiting for a break of this most recent And this gives me my confirmation to enter into a trade. So, the trade is opened here. The stop loss will still go at the bottom of my opening range. And I
[03:33]
take-profit ratio. I don't have to put the stop loss down here. It could also candle. And likewise, I don't have to always aim for one and a half times. And I will be testing out all of these different scenarios. And this completes
[03:47]
the breakout, pullback, and continuation pattern. The theory here is pretty simple, but it requires patience not to chase that initial move, but to actually wait for price to come back down and give a better entry. I jumped over to my
[03:59]
but it actually turned out to be a lot more complicated than I thought. And by test code. Let me know in the comments if you want to see the code and I can first challenge that I had with this system was how do I actually define a
[04:14]
breakout because this here is obviously a breakout, but then so is this. Price opening range. But I would trust this this one. Visually, it's easy to see the difference, but for my back tester, I
[04:27]
need to take into account the height of this breakout. And I made sure that this was greater than at least 1 times ATR to be considered a suitable breakout. I then configured the pullback and continuation logic, but I regularly had
[04:39]
to check my simulated trade log and fix any bugs that I found. Finally, I was happy with the accuracy of my back test, and this was the result over those 5 years of testing. The strategy seemed to perform okay for the last 2 years from
[04:51]
2023 onwards. But before that, it was pretty much sideways for the first 3 years. Going by the equity curve alone, I really wasn't impressed with this the win rate is actually very similar to
[05:04]
expected that waiting for a pullback to get a better price would actually give seem to have made much of a difference. What it has done, though, is reduce the overall number of trades. So now over that 5-year period, I only got 130
[05:18]
return for the strategy was pretty poor. So, it wasn't off to the best start, but then I thought maybe the 1 and a half times ratio was too restrictive. The so I should be able to aim for bigger profits. I reran the simulation and this
[05:32]
time I tested take-profit ratios starting at 2 1/2 and going all the way up to 4 1/2 in increments of 0.5. And it seems that each increment made the strategy perform that little bit better. So, it certainly was an improvement, but
[05:45]
I would still say that the equity curve overall for all of these is still pretty poor. and the final balance is far less than what my current strategy does. Then that I was getting and I realized the problem. This breakout, pullback and
[05:58]
continuation that's shown with these kinds of examples is an ideal scenario, but it almost never actually looks like this in real trading. This chart makes would be and the chart is super predictable. But this is what a real
[06:11]
screenshot of one of the trades that my back tester took. This is on the 5-minut time frame. So these first three candles formed my opening range high and low. I got the initial breakout which doesn't look as clean as the examples and then I
[06:24]
got my pullback. And this is the candle that confirmed the pullback. It broke back above it again. My entry then came at the next candle when it broke the high of the previous one. But then immediately price turned around and went
[06:36]
that my original strategy that buys the breakout would have entered somewhere around here which is not really that different to this entry price. In either taken a loss over here. Here's another example. We've got the 930 candle as
[06:50]
well as the two candles after that giving me the initial opening range high followed by a pretty strong pullback. the way through into the opening range. So that invalidated the trade. I waited
[07:03]
followed by a second pullback. Then this one looked pretty nice. Price broke it was rejected pretty strongly indicating that this has now turned into an area of support. My entry came at the break of that high. Stop loss down at
[07:17]
did actually work out. It went in the right direction. So, this is a good example. But my original strategy that buys the breakout immediately would have entered around here because that's where the 15-minute candle would have closed.
[07:29]
strategies is practically identical. The whole point of this breakout pullback better price than what I'm getting right now. So, maybe what I'm doing wrong is the trade. Instead, should I just place a stop order at the opening range? That
[07:45]
immediately for that bounce back up. Well, I tested that, too. This time, the stop loss is still at the bottom of the range. I have a 1.5 take profit, but now orb. And the results here are even
[07:58]
price has made the pullback and is now continuing back up, I'm losing far more is awful. But I wasn't ready to give up yet. I noticed something else in these examples, which is that when price came back down to the orb, quite often it
[08:12]
somewhere around the halfway point before bouncing back up. So maybe it's should be focused on, but it's actually the midpoint. And this is what it would breakout from the top of the opening range, but now a pullback down to the
[08:27]
for price to pull back all the way into this midpoint here, and that's where I'm looking for confirmation of a previous high being broken. I just enter immediately as it reaches the midpoint. I kept seeing this happen over and over
[08:41]
again. Oftent times almost to the pip, the price would retrace back into that up. The additional benefit here is that because I'm at the midpoint, my stop loss is far smaller. So, I don't need as much movement back up to get my one and
[08:54]
a half times or I could aim for even more. I was excited about this one and I So, then I tested it and this was the result. Somehow, this performed even for every one trade where this worked out, there's probably plenty others
[09:07]
where price just barreled all the way through, easily taking me out. By this point, I had spent many hours testing all these different variations, and none I didn't want to waste time on something that clearly wasn't working, so I
[09:20]
further. As disappointing as those results were, I think I know why they to fix it. The first problem, I think, is that many of the screenshots that we see in all of these videos that promote the strategy are these perfect
[09:34]
setup look really simple and reliable, trades don't look like this at all. Most of the time, the breakout isn't all that clean, or the pullback is confirmed, but price moves the wrong way anyway. But I
[09:47]
breakouts are the ones that have strong momentum, and they don't often pull back have small corrections along the way, example of a real trade that my bot took
[10:00]
the bot entered the trade, price just moved immediately towards the takerit. I'm essentially skipping out on the strongest breakouts, trading only those to the opening range. And I think that's the key reason my back test here failed.
[10:16]
pullback and continuation on its head a little bit, at least in the context of gave me another idea, which is actually to do the opposite of waiting for a pullback and instead focus on the momentum and the strength of the initial
[10:30]
breakout to see if it's possible to avoid some of the fake outs and catch do a back test on that idea. If you want me to make a video on it, then in the test to let me know that's something you guys want to see. And make sure to
[10:44]
guys want to see. And make sure to subscribe so you don't miss