
How to Spot a V-Shaped Reversal
45sQuick, visual explanation of a V-shaped reversal pattern that traders can immediately apply.
▶ Play Clip"The title promises a top-down chart lesson and delivers a detailed trade breakdown, though some parts are repetitive and could be trimmed."
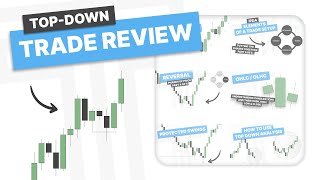
The video is a top-down chart lesson analyzing a prior S&P 500 (ES) trade. The instructor explains how to identify a V-shaped reversal on the daily chart, confirm it on higher timeframes, and then refine an entry using lower timeframes while managing risk and reward.
Aggressive move lower followed by aggressive move higher creates fair value gaps on both sides, forming a V-shaped reversal on the daily chart.
On the weekly chart, the aggressive down-and-up move forms a reversal candle, suggesting a bullish bias for the following week.
Monday opens as a consolidation after Friday's expansion, typical after a large move. The focus is on trading the continuation following the Tuesday reversal.
On the hourly chart, the reversal is confirmed by a series of down-closed candles and a closure through the low, signaling an anticipation of higher prices.
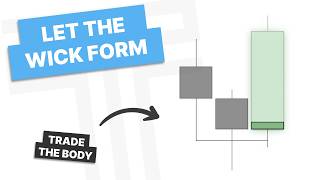
The ideal entry is where price respects the upper half of the previous daily candle, entering with a shallow wick to expand higher.
ES is preferred for longs when YM is strong and NQ is weak, as ES sits in the middle of relative strength, offering better risk/reward.
Refining the entry down to 5-minute, 3-minute, and eventually 1-minute charts to find an optimal point with acceptable risk/reward, using fair value gaps and state of delivery.
The instructor waits for a continuation entry that provides proper risk/reward rather than forcing a trade with extended targets, as price may reverse off the level.
Entry on the break of the high after a reversal candle, with partial profits taken at 2R and 5R, and trailing the remaining position, eventually exiting at a retracement.
Weekly Reversal Candle as Bias
Establishes the higher timeframe context that drives the entire trade setup.
01:47Instrument Selection Based on Relative Strength
Shows a practical method for choosing between ES and NQ based on YM strength.
04:04Patience for Risk/Reward
Emphasizes waiting for proper risk/reward rather than forcing entries, a key discipline in trading.
07:44Protected Low Concept
Illustrates how a closure through a low creates a protected low, enabling a confident entry with a tight stop.
08:51[00:00] How's it going everyone? In this video we are going to be doing episode 2 of my top-down chart lessons, in this case reviewing a trade from previous week on the S&P 500. Let's get into the example.
[00:23] You can see here on the daily chart we have an aggressive move lower and an aggressive move higher. You can tell this as we are generating fair value gaps on both sides of the market. We have an aggressive move lower and then we have this other fair value gap making an
[00:37] aggressive move higher. So that's forming a V-shaped reversal. Now if you look at a higher time frame, so if we go to the weekly time frame here after removing these drawings, you'll notice when you have an aggressive move lower and then
[00:50] back up, that's forming a reversal candle on a higher time frame. So with a reversal candle here, I'm looking for price to trade higher in this following week and going to take out this previous high. So going back to the daily chart, what do we have? We have Monday open up as a consolidation.
[01:06] That makes sense following a large expansion on Friday. So with the closure near the low, if we're going to frame a reversal or look for this reversal day, where can I look to trade that? Well, I can look for that previous day low as I talked about in my candle 2 video.
[01:21] Now, marking out my point of interest as a fair value gap, the easier trade does lie in the continuation. So, looking for the continuation following Tuesday reversal, I'm looking for Wednesday to trade higher.
[01:33] And that is the whole bias or idea for this trade is Tuesday has reversed, so looking for Wednesday to continue in line with this trend. as we have expansion, retracement, and short-term value gaps, looking for another expansion.
[01:47] So, what do I want to look for next? Well, if you've watched my playbook video, I want you to go down to the hourly chart. Down here on the hourly chart, I want to confirm that reversal. So I'm going to go and find the reversal point, which is this low.
[01:59] I'll find the low, I'll look for the series of down-closed candles that made that low, and did we get a closure through that level? And we did. So now I'm anticipating this reversal to be confirmed, and for the next candle we trade higher. Now where do I want to see this candle trade higher from?
[02:15] Well I want to mark out 0.5 of this previous candle. Now for simplicity's sake I'm going to go ahead and remove my drawings and just leave on my indicator. So you can see we had a reversal Friday and Monday we didn't really get any action right we just had a consolidation or this slow
[02:29] shallow move. So expansion is a consolidation or a retracement. Well I view it as a retracement And then we do have a reversal there. It's a bit tricky to try to trade that and that's why I say continuations are much easier.
[02:42] So following into this next day, where do I want to see price respect? I want to see it respect the upper half of this daily candle. So I want to see a small shallow wick so we can expand higher. So that is where I'll be looking for a point of interest or for price to reverse out of.
[02:56] So as we move ahead into the New York session you can see we have these short targets as well as that previous daily high or that weekly high And what are we doing into this right you can see we do have a little reversal off previous day high this doesn make sense
[03:11] for a bearish perspective as we are just leaving these failure swings here so that is basically irrelevant to me and so taking a look at this this could be considered a retracement but i don't really trust this this is just a consolidation so if we are forming a consolidation what do we
[03:27] want to look for. Well we have the range high and then we have the range low. So I want to see the range low be taken out into a point of interest. I have a fair value up here in the other half of the previous day's candle. So I want to see price form a reversal in here.
[03:46] Now if you take a look I know I want to have this point of interest. Here is a reversal candle. I can be looking to trade this higher. Now let's go over a few things. We're going to go ahead and go to the 4-hour chart and expand out. Now why did I choose ES and not NQ as I do prefer to trade NQ?
[04:04] Well I looked at YM. Generally YM is strongest, NQ is weakest, and then ES will be in the middle or vice versa. But here when I see that YM is very strong I know that NQ is the weakest pair.
[04:17] So if I'm looking to trade long I would prefer to trade ES longs over NQ longs. So coming back to ES here. That is the 4 hour chart. You can see we have this reversal. And let's dig into this and see how I got an entry. So we're down here on the 5 minute chart. I'm looking for price to reverse
[04:33] out of this range low here and trade to the highs. That is my whole idea. So I'm looking for a reversal in here. And you can see price has a bearish reversal here on the 9am open. It does
[04:45] go to its max expansion. And what do we have? An aggressive move lower met with an aggressive move higher. That's forming this higher time frame wick and I have a change in the state of delivery. Now those of you that know my model and the t-flot, you know I'm looking for certain areas
[05:00] to respect here. If we are going to form a higher time frame wick here, I want to see 0.5 of this wick be respected. And if I'm wanting to see this change in the state of delivery be respected, if I'm anticipating this low to hold, I want to see 0.5 of that be respected. So overlapping those
[05:16] to or looking at that I know I want to see price hold this area in here. I'll go ahead and remove all the drawings to clean it up. This is where I'm looking for price to hold. Now do I have a point of interest in this area? I do. I have a fair value depth right here so that will be my point of
[05:32] interest where if I'm looking to trade this I'm waiting for price to come back into this area to trade it higher. Now why wouldn't I just take an entry right here? Well I want to be able to exit or partial off before or at my short-term targets.
[05:46] If I take an entry up here, and I have to allow price to trade into there in respect 0.5 of this order block, that is not giving me good risk to reward. So I'm going to wait for price to retrace to give me an entry.
[05:58] Now I am trading a reversal here, and that is because I do have a lot of context and I was confident in my higher time frame bias. But generally I going to let this higher time frame candle close and then trade the 10 a continuation So what I did here is we had a very aggressive move lower Now this is where I could look to
[06:16] take a limit order in here, set my stop there, and look to trade to the high, and that would give me two R, and that is time. Now I still wanted some extra confirmation or to trade off of this continuation in here. If I was going to wait for the five minute continuation,
[06:31] where would that have formed? It would have formed right here, and once again, I would not have proper risk to reward to trade to these short-term highs here. So with that idea in mind, I'm then going to refine this entry. So I went down to the three minute in this area, and you can see we're
[06:47] also balancing out that fair value up in here. And I noticed the same thing. I'm waiting for this continuation in here. I'm not really going to be able to get good risk to reward to this high. So this is where I will rarely, and in this case I did, refine it down to the one minute time frame.
[07:02] So with this I'm going to look for a continuation out of this area and so I want to see an aggressive move lower met with an aggressive move higher. So let's see if that occurs. I was actually looking to get entry in here, just none of
[07:18] these candles were convincing enough for me to take a entry and put my stop on these turn lows. And here you see we have expansion down met with an expansion up and so what is that forming? A higher time frame lick.
[07:31] this closure through here forms a protected low right here. So now I can anticipate this low to hold as we trade to this high. So once again, can I get proper risk to reward with that?
[07:44] Well, no, I can't. So with that, I'm looking for another continuation entry. I'm just looking to seek continuations until the risk to reward makes sense. I'm not trying to force myself on a trade and just extend my target,
[07:57] because often if you do do that, price may reverse off of that level there. So what am I looking for? If we have expansion, I'm looking for a retracement to get a new expansion. For expansion, consolidation, a move lower to then trade it higher.
[08:12] So what do I notice here? We get expansion, and then I'm looking for this to be a retracement. Why? Because we retrace into a fair value deficit. So with that idea in mind, I'm going to fractalize what I did on the daily.
[08:25] This is a reversal candle on the one minute, right? So if this is a reversal candle, I have all this context where I don't want to see this low get taken. I want to see 0.5 of this be respected here.
[08:38] This is where I need price to form a low if I'm going to trade it higher with my model. So in that case, I went and just waited for price to reverse in here only one minute, put myself on that low. I gained entry right on the break at the high, actually.
[08:51] And then I'm looking towards these highs on the left, or just over 4R. Now, I did go ahead and partial out at 2R, and you'll notice that in the executions, but you can see once we get the closure through here, then I'm expecting what low to hold?
[09:08] This low to hold. So now I really feel protected with my stop even with that type of entry Now it is possible if I did miss that entry to still take an entry like this right on the retest as long as it gets to R because I have a protected low in
[09:22] continuation here. But let's see how this works out. And you can see we go and trade to those highs. Now for me I got out of all my position when we trailed it. I was expecting it to trade
[09:35] a bit higher. We got this consolidation. We broke out of this high and for me if we are going to have expansion, a consolidation, or a break, I want to see a retesting for that to go. If I have a consolidation, a break, and then push lower, I'm doing that as a reversal that can then trade lower,
[09:52] and that's where I want to be out of my position. If you notice my executions, I took off at 2R, I took off at 5, and then I trailed my position, and I essentially got out at the exact same point that I took profit here. So my runner just didn't do anything besides my last take profit.
[10:06] You can see me form that little low there, I get trailed out, and then that is the rest of trade there. Price does end up going to its final objective. We come back out here on the hourly chart. So I'm fine with my position and how I trailed it and if you notice we did get quite the retracement
[10:23] back into this area before it did occur. So the main points if we're going to review this one more time before I end the video is going out to the daily chart. We're taking a look at the daily chart and looking at the phases of price. I have expansion met with an expansion which is a reversal so I'm
[10:39] So I'm looking for a continuation out of that. Monday, we have a consolidation. Tuesday, we saw Monday's consolidation forming a reversal. So I'm looking for Wednesday to trade higher. When I go to the hourly time frame, I'm looking for price to trade out of where?
[10:54] The upper half of this daily range. As if price is expanding, I want to see shallow retracements. What do we get? We get expansion consolidation. And if you watch my consolidation video, I'm looking to trade from the low in the consolidation.
[11:07] Once we've sweet-stopped the low in the consolidation, that is when I then go and use my indicator on the lower timeframes, or in this case the 5 minutes, and I'm looking for price to form a low in here.
[11:19] So going back to there, this week it's on a reversal, so I'm looking to trade that reversal. I just had to adjust how I was going to enter in here in terms of risk to reward and placing my stop where I felt comfortable.
[11:32] So I ended up getting entry in here, and then I want to be able to take profit at these highs as those are the intraday highs and if we are going to not expand in this day that's where i'm expecting a retracement right that's where i want to be taking off some of my positions
[11:45] and so if we let this go you can see we do get a little retracement in here before expanding higher right so that is what took me out and i'm fine with that trade i did miss
[11:57] this move here but i would prefer that to have just occurred on this expansion here so that's part of the game. If you have any questions be sure to leave them in the comment section below and I'll get to them when I can. Other than that I hope you have a great rest of the day
[12:10] and I'll see you guys next time. Have a good one.
⚡ Saved you 0h 12m reading this? Transcribe any YouTube video for free — no signup needed.