
How to Spot a Liquidity Grab
43sReveals a concrete trading technique using volume to detect manipulation, which is highly engaging for traders seeking an edge.
▶ Play Clip"Delivers a concrete, actionable technique with a real example—solid, though the title oversells the simplicity."
This video demonstrates how combining price action with volume analysis can reveal market manipulation, specifically liquidity grabs. The creator shows a practical TradingView setup and a real trade example to illustrate the concept.
Price can be manipulated, but volume is harder to fake. Analyzing price-volume relationships helps identify whether a move is genuine or engineered.
Add the volume indicator from TradingView, enable volume moving average, set it to white, and use a length of 20.
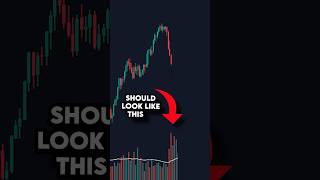
During a price spike and crash, volume stayed flat at the average instead of rising with bearish pressure—a sign of a liquidity grab, not real selling.
Enter at the fair value gap below the liquidity point, set take-profit at the prior high, and place stop-loss below the gap. The trade worked as predicted.
Combining price and volume analysis provides a reliable edge in identifying false moves and entering high-probability trades.
Why is volume harder to manipulate than price?
Price can be manipulated, but volume is harder to fake.
00:02
What settings are used for the volume moving average in this setup?
White color and MA length of 20.
00:16
What does flat volume during a price drop indicate?
A liquidity grab rather than genuine bearish selling.
00:29
Where is the entry point placed in this strategy?
At the fair value gap below the liquidity point.
00:55
Volume as a Truth-Teller
Establishes the core principle that volume reveals manipulation that price hides.
00:02Flat Volume Signals Liquidity Grab
Provides a concrete, testable pattern for identifying false moves.
00:29Complete Trade Setup
Shows a full entry, stop, and target plan based on the volume-price relationship.
00:55[00:02] price, but they can't manipulate volume that easily. Volume feed is very useful. It's not going to get you 100% trades. You can actually tell from price and volume relationships whether somebody's playing with you or not. Let's try it.
[00:16] Go to the indicators tab. Search volume. Click this one by trading view. Go to the settings of the volume indicator and check volume moving average. Make it white and make the MA length 20. Here price was spiking up but then had a
[00:29] catastrophic drop and price plummeted. But something very interesting is happening here. If we take a close look at the volume, it stayed exactly the same during this drop when in reality bearish volume should be rising during
[00:42] this like this. In this instance, volume stayed the exact same at the average volume. So we can expect this to be a liquidity grab and look for an entry. Here we have the point of liquidity. Right below that is a beautiful fair
[00:55] value gap. That's where we enter. Price reaches our fair value gap. We enter. Set our takeprofit at the high. Set our stop loss below the gap. And it indeed was a liquidity grab. Looking at price and volume together is an edge in my
[01:09] and volume together is an edge in my humble opinion.
⚡ Saved you 0h 01m reading this? Transcribe any YouTube video for free — no signup needed.



![BEST MACD Trading Strategy [86% Win Rate]](https://img.youtube.com/vi/rf_EQvubKlk/mqdefault.jpg)