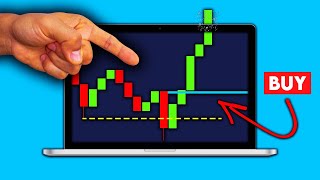

Trade Reversals Like a Pro
44sOpens with a bold promise of insane risk-reward ratios, hooking viewers interested in high-profit trading strategies.
▶ Play Clip"Delivers a solid, actionable strategy with backtest data, but the sponsor segment and indicator promotion dilute the value."
This video presents a price action trading strategy focused on identifying reversals through 'liquidity grabs'—false breakouts of support or resistance. The creator explains the two-step process, entry and stop-loss placement, and shares backtest statistics and tips to improve performance, including using divergences and higher timeframe confluence.
The video introduces a strategy for trading exact reversal points, claiming it works across stocks, forex, and crypto on all timeframes, offering high risk-reward ratios.
A liquidity grab is defined as price breaking support/resistance and then reversing. It adds fuel to reversals by triggering stop losses of traders who entered on the breakout.
Thomas Volkowski's backtest of 14,000 trades shows that liquidity grab patterns significantly outperform non-liquidity grab patterns in percentage gain.
Promotes Hankertrade, a forex broker, offering a deposit match up to $25,000, low fees, high leverage, and negative balance protection.
Entry is at the candle that made the liquidity grab. Stop loss is placed just beyond the grab, and take profit at a recent high/low, resulting in high risk-reward ratios.
The strategy is integrated into a private indicator (tradinglab.ai) that automatically marks liquidity grabs, entries, and signals, color-coded for long/short.
Losses are small compared to wins, making the strategy profitable overall. Example shows a loss followed by a price spike, but the loss was minimal.
Backtest shows that if liquidity grab and entry candle are within 10 candles, the subsequent move is more impulsive, leading to better entries.
Adding momentum divergence (e.g., higher highs in oscillator while price makes lower lows) increases probability of success.
Best results occur when the signal aligns with support/resistance on a higher timeframe, avoiding mid-range signals.
The liquidity grab reversal strategy offers a systematic approach to trading reversals with strong risk-reward ratios. Combining it with the 10-candle rule, divergence, and higher timeframe confluence can significantly improve its effectiveness.
What is a liquidity grab?
A liquidity grab is when price breaks a support or resistance level and then reverses, creating a fakeout.
00:57
Why does a liquidity grab add fuel to a reversal?
It triggers stop losses of traders who entered on the breakout, causing a stronger impulsive move in the opposite direction.
01:10
What entry point does the strategy use?
The entry is at the candle that made the liquidity grab.
03:30
Where is the stop loss placed?
The stop loss is placed just beyond the liquidity grab (below for long, above for short).
04:10
What is the 10-candle rule?
If the liquidity grab and entry candle are within 10 candles apart, the subsequent move is more impulsive.
07:20
How can divergence improve the strategy?
Divergence (e.g., price making lower lows while momentum makes higher highs) adds a bullish signal, increasing probability of success.
07:42
Why is higher timeframe confluence important?
Signals at support/resistance on a higher timeframe are more reliable than those in the middle of a range.
08:34
Liquidity Grab Definition
Core concept of the strategy, clearly defined with a psychological rationale.
00:57Backtest Evidence
Provides statistical backing from a known trader, adding credibility.
01:36Simple Entry Rule
The entry is straightforward and easy to apply, making the strategy accessible.
03:3010-Candle Rule
Offers a specific, testable improvement based on backtest data.
07:20Higher Timeframe Confluence
Emphasizes the importance of context, a key principle in trading.
08:34[00:00] Reversal. One of the best ways to trade because you are sniping the exact point of where price changes direction. Meaning if you trade the exact reversal point you are not only getting insane risk reward ratios but you're also making a ton of profit on top of it. I found a perfect
[00:17] way to find reversals like this, like this, and like this. It works for everything. Stock, Forex, Crypto, it doesn't matter. And the even cooler thing, it works on all timeframes.
[00:32] That does sound awesome. I'm going to go over how to perform this strategy, what to look for specifically, and I'm going to go over some special little tricks to make it perform even better, and I'm going to even share some backtest results for it.
[00:44] Let's not waste any time, let's get straight to it. So this strategy is price action based, and really, it only has a couple steps. For the first step we are looking for what's called a liquidity grab.
[00:57] A liquidity grab is simply when price breaks a support or resistance and does a fake out and heads in the opposite direction. We want a liquidity grab because it adds fuel to the reversal we are looking for. The reason being, think of it like this.
[01:10] If we have a resistance right here and price breaks this resistance like this, a lot of traders will enter a long right at this point because they think the price is going to start heading upwards because of this break.
[01:22] They'll enter along here and set their stop losses around this area. Meaning, if this is a liquidity grab and price takes this upward movement, when price reverses, it's going to hit all of these traders' stop losses, making the price move downwards even harder.
[01:36] So if we found this liquidity grab and entered a short, we would benefit from this strong impulsive movement, making us some easy profits. Pretty simple. And the statistics even back this up. These backtest results are from Thomas Volkowski, a famous trader.
[01:50] And look at how interesting this is. So comparing if the first value is above the second, so that being a liquidity grab like we just talked about, like this. Compare that to if the first value is below the second, so something like this.
[02:03] You can clearly see the liquidity grab version performs way better. So out of the 14,000 trades that he tested, the percentage gain for liquidity grab performed way better than a pattern that did something like this.
[02:17] So pretty interesting. So now we know why we are looking for a liquidity grab. So that's step one is finding a liquidity grab. It can be either sell liquidity or buy liquidity whichever you prefer to trade Once we find this liquidity grab we move to step two which involves the entry But wait aren you forgetting something Who the hell are you Well I Mr Double Your Money of course
[02:38] Mr. What? How are you doubling your money? It's simple. Have you heard of Hankertrade? Hankertrade, which is the forest broker I use, is running a special promotion where if you deposit money using the link in my description, it will match it up to 25 grand.
[02:53] So if you deposit say $6,969 the first time you deposit, they will match that and give you $6,969. And that's just one of the benefits of using them.
[03:06] They have some of the lowest fees on the market, they have up to 500x leverage, they have extremely low spreads, negative balance protection, and overall just a really great broker if you need one for Forex. I cannot recommend them enough.
[03:18] So yeah, if you want to be like Mr. Double Your Money, go to the link in my description and get that first time deposit on it. Like seriously, it's free money. Okay, let's go back to the most important part of the strategy, which involves the entry.
[03:30] I get long entry. The entry is pretty simple. You are going to mark your entry point at the candle that made the liquidity grab. For example, here we have a nice little support. Christ breaks the support with this candle right here.
[03:43] Our entry would be at the candle that made the liquidity grab. So your long entry would be at this point right here. because this candle made this liquidity grab. It's the same thing with short. You have a resistance, price breaks this resistance fairly,
[03:58] does a liquidity grab, your short entry would be at the bottom of this candle that initiated this liquidity grab. So, right here. So, going back to our first example, this candle initiated this liquidity grab,
[04:10] so we set our entry point right here. Now, what makes this strategy so successful is the risk-reward ratios are absolutely insane. Because you are finding the exact bottom or top of the move, the profits are going to be really big,
[04:23] and the losses are going to be very small. So for this example, you would enter here, set your stop loss right below the liquidity grab, and you're going to set your take profit at a recent high. So, like this. And just look at this risk to reward ratio. Even if this trade is a loss,
[04:39] it's going to be a very small loss. And if it's a win, well, we're fucking rich. So in this example, you can see price reversed exactly at this point and hit our huge take profit for a perfect trade. Now I'm going to show you guys just how successful the
[04:54] strategy is and then I'm going to give you guys some tips to improve the strategy even more Now I know a lot of you guys are lazy that exactly why I added this little strategy to my private indicator This strategy performs so well that I just had to add it The indicator will automatically find everything for you
[05:10] It'll find the liquidity grab, mark the entry point, and will also tell you exactly when to enter. It's basically spoon feeding you. It even color grades it depending on if it's a long or short trade. It saves you a ton of time with the strategy so you don't have to look for the liquidity grabs all day
[05:25] and basically does all the work for you. All you have to do is basically follow the signal. If you're interested in checking out the indicator, you can go to tradinglab.ai or I'll leave the link in the description. So in order to enable the strategy on the indicator, you would go to the settings of
[05:38] the indicator by double clicking on any of the signals and set show reversal to true. And just like that it'll find all the liquidity grabs and entries for you. So just look how good the strategy performed.
[05:50] Here the indicator marks the liquidity grab for us, it starts to mark the entry point and the signal to enter. We enter a short trade since the indicator is red, set our stop-loss right above the liquidity grab, and set our take profit at a recent low.
[06:03] And look how this chart fell extremely hard after the signal. Another example. Here the indicator automatically marks a bullish liquidity grab. We wait for the entry signal. Once we get it, we enter, set our stop-loss right below the liquidity grab, set our take
[06:18] profit at this recent high all the way up here, and then there's this strong impulsive move to the upside, giving us a massive win. And we can really just keep repeating this. Indicator marks bearish liquidity, entry signal, stop loss, take profit at a recent low,
[06:33] strong impulsive move. Indicator marks bullish liquidity, entry signal, stop loss, take profit at a recent high, strong impulsive move. Now, of course, this strategy isn't absolutely perfect, and there are going to be times when it doesn't work. For example, here the indicator indicated
[06:48] bullish liquidity. So we set or take profit and stop loss like usual, but the chart ended up not going in our favor. Funny enough, right after it hit our stop loss, it skyrocketed. Classic. But if we take a close look, look at how small this loss was. So sure we lost this trade, but if we
[07:04] compare it to all of our winners with these huge massive wins, this loss is really just a pebble. That's what makes this strategy so profitable. So as for improving the strategy even more, like I promised before, here's some interesting statistics from the backtest results.
[07:20] On the daily time frame, peaks closer together than 10 days saw a slightly larger drop compared to peaks farther apart So if the liquidity grab and the entry candle were closer than 10 candles apart the drop was a lot larger compared to the peak farther apart So the backtest results are saying peaks like this had a more impulsive drop than peaks like this
[07:42] So that's very interesting to note. So if you want optimal entries you should look for liquidity graphs with peaks closer together. Another way to improve this is by adding confluences like divergence. To do this simply go to metatrader, click insert, then indicator, scroll down to
[07:59] oscillators and click momentum. So here you can see the indicator gave us a long buy signal. But something else to notice is that here the chart did a liquidity grab so it's making lower load. But if we look at the momentum oscillator it's making higher highs. So this is a divergence
[08:17] and it's also a very bullish signal. So we combine both the powers of the divergence and the bullish liquidity grab and it gives us a higher probability of working in our favor. And just like that we have an amazing trade. Then my final tip will also make this perform a lot better. So this whole
[08:34] liquidity grab strategy works best if you're finding reversals at the bottoms or top of big moves. If you're trying to find liquidity grabs in the middle of moves while the chart is going up or down like this it doesn't work so good. So to find bottoms or tops moves do this. So here we
[08:51] are on the 15 minute time frame and we get a buy signal. So what we end up doing is we then move to a 1 hour time frame and we see this buy signal happened exactly at a support on a higher time frame. So we know there's a strong demand here on the higher time frame and on top of
[09:08] that we have a liquidity grab on a lower time frame which is a great confluence. We move back to the 15 minute time frame and do our normal stop loss and take profit and it was another beautiful trade. So just for a bad example, if we were on the 15 minute time
[09:23] frame and got a signal like this and then moved to the higher time frame like the hour and the signal happened here we would not enter on this trade because the move is happening in the middle of this range on a higher time frame and like i said before this strategy performs the best if it's on
[09:39] the absolute top or bottom of the range so if you pair all of these together the normal liquidity grab strategy the 10 candle rule divergences and higher time frame support and resistance I'll tell ya, this strategy performs absolutely amazing.
[09:54] Go try it out, let me know what you guys think. If you're interested in the indicator, I'll leave a link to it in the description. Thanks for watching, and I'll see you guys next time. Well, I'm Mr. Double Your Money, of course.
⚡ Saved you 0h 10m reading this? Transcribe any YouTube video for free — no signup needed.



![BEST MACD Trading Strategy [86% Win Rate]](https://img.youtube.com/vi/rf_EQvubKlk/mqdefault.jpg)