I Automated My Trading and It Backfired
45sThe hook reveals an experiment gone wrong, sparking curiosity about the unexpected mistakes in automated trading.
▶ Play Clip"The title promises a revealing experiment, and the video delivers a genuine, detailed account of automation pitfalls—though it's padded with some repetition and a call to subscribe."
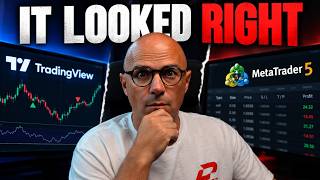
The video documents an experiment where the creator automated a manual RSI divergence and Fibonacci retracement trading strategy into a TradingView indicator and then a MetaTrader 5 (MT5) expert advisor (EA). The goal was to test whether the automated bot would replicate the exact trades the creator would take manually. The experiment revealed significant discrepancies between the indicator and the bot, highlighting the challenges of translating a visual, discretionary strategy into precise computer code.
The creator took a manual trading strategy, turned it into a TradingView indicator, and then converted the same rules into an automated MT5 bot to compare their outputs.
The bot initially appeared to work—taking trades and showing profitable backtests—but on closer inspection, it wasn't always following the intended strategy, revealing critical errors.
The strategy combines hidden RSI divergences with a Fibonacci retracement, looking for a specific relationship between price, RSI, and the 0.618 level.
The creator advises using AI to build a TradingView indicator first, not a bot, so the computer can visually show its interpretation of the strategy for comparison.
By comparing the indicator's signals to manual ones, the creator iteratively adjusted the rules until the indicator closely matched his visual interpretation.
Translating the rules to MT5 for longer backtesting initially seemed successful, but the bot's lack of visual context made it hard to verify its logic.
Comparing trades between TradingView and MT5 revealed mismatches—some trades were taken by one but not the other, despite supposedly identical rules.
A key issue was how the computer defined swing highs and lows, especially with equal highs on adjacent candles, which affected RSI comparisons and Fibonacci levels.
The bot's first version had a 75% win rate over 8 years, but inspection showed winners were smaller than losers, and the structure didn't match the original indicator.
The creator emphasizes mastering a strategy visually first, then using AI to create an indicator that shows its work, before attempting full automation.
He advises explaining the strategy simply (like to a five-year-old) and using that detailed explanation to prompt AI tools like ChatGPT or Grok.
The experiment underscores the importance of validating automated trading systems against manual visual checks. The creator plans to release a detailed tutorial on his exact process for structuring and prompting AI to build accurate indicators.
What is the first step recommended before automating a trading strategy?
Build a TradingView indicator that visually represents the strategy so you can compare it to your manual interpretation.
01:44
What was the main issue with the MT5 bot's swing high/low detection?
The computer's definition of swing highs/lows, especially with equal highs on adjacent candles, affected RSI comparisons and Fibonacci levels, leading to different trades.
04:12
What was the win rate of the first MT5 bot version over 8 years?
Approximately 75%.
05:05
Why did the 75% win rate not indicate a good strategy?
Because the winners were much smaller than the losers, and the trade structure didn't match the original indicator's ideal placements.
05:19
What does the creator suggest doing before prompting AI to build a bot?
Master the strategy visually, explain it simply (like to a five-year-old), and then use that detailed explanation to prompt AI to create an indicator first.
07:27
Indicator Before Bot
This is a crucial, actionable piece of advice that can save traders from costly mistakes by ensuring the AI's interpretation matches their own before automation.
01:44Swing High/Low Ambiguity
It highlights a subtle but critical technical detail that can completely change trade outcomes, illustrating the complexity of translating visual analysis into code.
04:12Hidden Flaws in Backtests
The 75% win rate example demonstrates that superficial metrics can be misleading, emphasizing the need for deep trade-by-trade inspection.
05:05Explain Like I'm Five
This principle of simplifying a strategy to its core essence is a powerful method for ensuring AI understands the logic correctly.
07:27[00:00] I ran an experiment. I took one of my trading strategies, turned it into a trading view indicator, made sure it was finding the exact trades that I wanted to, so it had a one-to-one visual representation of what I see when I look at the chart and what the indicator is telling me.
[00:16] And then I took the exact same rules and turned them into a completely automated trading bot on MetaTrader. Same strategy, same entries, same stop losses, same take profits. At least,
[00:29] That's what I saw. Because when I started testing the bot, something really strange happened. It worked. It was taking trades. The backtest was profitable. Some of the numbers actually looked really good. But when I started going through the individual trades, I realized the
[00:44] bot wasn't always trading the strategy I had built. And one of the mistakes it made was so ridiculous that it completely changed the way I think about automating trading strategies. Now, let me show you what happened. The strategy itself isn't really the important aspect of this video,
[00:59] but I'll explain it quickly so you can understand what the computer was trying to do. I made a previous video about this, and I've traded RSI divergences for years. One particular setup that I like combines hidden RSI divergences with a Fibonacci retracement.
[01:13] Basically, there's a move in the market, price pulls back, and I'm looking for a very specific relationship between price, RSI, and the 0.618 Fibonacci level. When everything lines up, that's my trade. Now, normally when I'm trading this myself, it's incredibly visual. I can look
[01:29] at the chart and say, that's the move. That's the high, that's the low, that's the retracement, and that's the divergence. I look at how the candle looks at the Fibonacci level, and that's my entry. And that's important because before I automate anything, I first built it as an indicator
[01:44] on trading view. And if you're thinking about using AI to build your own trading system, I really think that you should do this first. Don't immediately ask AI to build you a trading bot. Ask it to build you an indicator that shows what it thinks your strategy is.
[01:58] Because what you tell it and how it interprets it two completely different things Now the computer has to show its work This was basically my first test I explained my strategy and had it plot what I see visually on the chart
[02:11] Whenever the computer thought there was a setup, it showed it to me. And I could sit there looking at the chart and compare what the computer saw against what I saw. Sometimes I'd look at a signal and think, yep, that's perfect. That's exactly what I would have traded.
[02:24] Then I'd find another one and think, no, no, that's not right. So I'd figure out why it was showing me that, change the rules, run it again, and slowly the computer started seeing the chart more like I did. That's one of the reasons I find AI to be extremely, extremely, incredibly useful.
[02:40] I'm not necessarily asking the AI to find me a profitable strategy. I'm saying, here is what I already do. Help me explain it precisely enough so that a computer can do it for me. Those are two very different things.
[02:52] Eventually, I got the trading view indicator pretty damn close to what I see. So now came the actual experiment. I wanted to see what would happen if I took those rules and gave them to MT5, because now I could turn it into an expert advisor, an EA,
[03:04] and test the strategy mechanically longer across more years of market data. So I translated everything over, and initially, it looked like it worked. MT5 started taking trades.
[03:16] I had entries, stops, targets, winners, losers, an equity curve, all the stuff you normally look at when backtesting a strategy. But there was one massive difference. I couldn't necessarily see its thought process nearly as clearly anymore.
[03:29] It just showed me entries. On TradingView, when I saw the trade, I could see why the trade existed. It had the start of the impulse move, the end of the impulse move, the Fibonacci retracement level, the level where it broke the previous structure,
[03:41] the take profit, and the stop loss, all on a single indicator. On NT5, I basically saw sell, and then it trades. And that's a problem because I started comparing the individual trades between what TradingView was giving me and what MT5 was giving me,
[03:54] and some of them matched almost perfectly. Same setup, almost identical entry, same stop, same target, beautiful. But then TradingView would take a trade and MT5 wouldn Or MT5 would take a trade and TradingView didn And I remember I given the exact same strategy So how is this possible
[04:12] It turned out one of the problems was something ridiculously small. The swing highs and the swing lows. To a human, this seems obvious. You look at a chart and there's a swing high. But the computer doesn't see a chart like you do.
[04:24] Imagine two candles next to each other with the exact same high point. Which one counts? The first candle? The second one? Both? Neither? that tiny decision matters. Because if the computer chooses a different high, now it's comparing RSI to a different point.
[04:37] That can change completely where the divergence exists. That can change where the impulse is measured. And that changes the Fibonacci level. One tiny difference at the beginning can produce an entirely different trade at the end.
[04:49] And that's when I started realizing how dangerous this was all becoming. One tiny little fraction decimal point of an error blows the strategy. And the issue is I wouldn't necessarily know what's happening. Because if I had just looked at the MP5 results, I wouldn't necessarily know any of this was happening.
[05:05] And this wasn't even the biggest problem. My first version entered trades at a market execution once the setup was confirmed. And then I tested that version for like eight years. It had about a 75% win rate. And now imagine that's where I stopped.
[05:19] Imagine I posted the screenshot online, trading bot gives 75% win rate, looks incredible. Except I started inspecting the actual trades. the winners were much smaller than the losers. Nothing lined up to the original trading view indicator
[05:34] where it had perfect structure, perfect placement for the stop loss, perfect placement for the take profit. Everything was ideal. And this was taking the same concept,
[05:46] but completely skewing the structure of where the impulse move was measured to and from. And this is why I wanted to run this experiment and make this video. Because a lot of you guys, are new into trading. You are
[06:00] interested in making a trading view indicator You want to create the perfect setup for your daily trading And the issue is you must first learn that specific setup so that you can visually see it on the chart Then once you have a concrete idea of what it looks like do your best to translate it into something a computer can understand and have it make version 1 version 2 version 15 until it matches exactly what you see
[06:29] And it shows its work on the indicator. It shows you the exact levels, what your structure is, what the price movement is, how the RSI divergences are working, what's bullish structure look like.
[06:41] All of those things need to be visually represented on the chart. That's why I always recommend start with a trading view indicator. Because a lot of you guys are going to be tempted to immediately go and do an MT5 EA, automate everything, walk away.
[06:57] That is going to ruin your life entirely and blow account after account after account. Within the next month or so, because this is extremely important to me, I'm going to do a tutorial video that's like an hour long.
[07:09] My exact process of how I'm going about structuring this and how I'm prompting AI to get what I'm thinking into its brain. But for now, what I want you guys to learn, whatever strategy you're working on, or if you haven't learned one yet, learn one.
[07:27] Then, master it. Absolutely master it. Get something that makes sense to you, so much so that you can explain it to a five-year-old. Then, make an extremely wordy version of that explanation to the five-year-old and start talking to your AI. Whether you're using ChatGPT, whether you're using Grok, it doesn't matter.
[07:47] what I want you to do is use TradingView, use AI, and use your knowledge in a cohesive environment where you're getting almost a one-to-one depiction on your TradingView chart of what your eyes
[08:01] visually see. Let me know in the comment section if you actually want to see that hour-long tutorial. If this video was helpful for you, please share it with your friends. Thank you so much for watching and we will see you in the next one.

⚡ Saved you 0h 08m reading this? Transcribe any YouTube video for free — no signup needed.