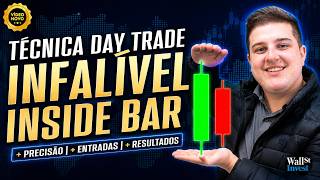

Inside Bar: The Foolproof Trend Technique
60sDirectly addresses a specific, actionable trading strategy that promises high accuracy, appealing to traders seeking an edge.
▶ Play Clip"The title promises an 'infallible technique' but the video honestly explains it's not 100% effective, though it is a reliable trend strategy."
This video explains the Inside Bar pattern, a price action technique for identifying trend entries in day trading. The presenter, Norton, demonstrates how to trade this pattern across various markets including stocks, forex, and crypto, emphasizing risk management and simplicity.
Patterns like pregnant woman, shooting star, marubozu, hammer, head and shoulders are part of price action analysis, used to anticipate trend movements.
An inside bar is a candle whose high and low are within the high and low of the previous candle. It signals a potential breakout.
The strategy uses only candlestick reading, no indicators. It can be applied to any market and timeframe.
Risk management is 80% of trading. Limit daily losses and set specific financial goals. Example: aim for R$100 profit, stop at R$80-100 loss.
Entry occurs when the candle after the inside bar breaks its high (for buy) or low (for sell). Stop loss is placed at the low/high of the inside bar or the prior candle, with a buffer to avoid whipsaws.
Target must be at least 1:1 risk-reward. For example, if stop loss is 10 points, target should be at least 10 points.
For day trading, the 5-minute chart is ideal. Longer timeframes increase profit potential but also loss potential.
Only trade inside bars when the market is trending, not sideways.
Backtests show moving stop loss during a trade reduces success rate by 80%. Let the trade play out.
The Inside Bar pattern is a simple yet effective trend-following technique suitable for any market. Success relies on strict risk management, trading with the trend, and avoiding interference with stop losses.
What is an inside bar?
A candle whose high and low are within the high and low of the previous candle.
07:42
What is the entry condition for a buy trade using inside bar?
The candle after the inside bar must break the high of the inside bar.
09:01
Where should the stop loss be placed for a buy trade?
At the low of the inside bar or the low of the candle before the inside bar, with a buffer to avoid whipsaws.
09:59
What is the minimum risk-reward ratio recommended for inside bar trades?
At least 1:1 (target equal to stop loss distance).
10:54
When should you NOT trade inside bars?
When the market is moving sideways; only trade in trending markets.
14:18
What happens to success rate if you move your stop loss during a trade?
It drops by 80%.
16:55
What timeframe does the presenter recommend for day trading inside bars?
5-minute chart.
12:17
What percentage of trading is driven by emotion and risk management according to the presenter?
80%.
04:27
Risk Management is 80% of Trading
Emphasizes that emotional control and risk limits are more important than entry techniques.
04:11Inside Bar Entry Rule
Clear, actionable rule for entering trades based on price action.
07:28Target Proportional to Risk
Simplifies trade management by tying target directly to stop loss distance.
10:54Don't Move Stop Loss
Backtest evidence shows moving stop loss drastically reduces success rate.
16:14[00:01] patterns like pregnant woman, shooting star, marubozh, hammer, shoulder, head and shoulders. All of this is price section analysis. It's a type of squad trading that section analysis. It's a type of squad trading that analyzes the shape of candlestick patterns.
[00:16] several readings and charts have been developed, identifying whether, if that pattern were to happen again, it had a chance of initiating an upward trend, a downward trend, or continuing the upward movement or continuing
[00:30] a downward trend. So, by understanding how this works, you can anticipate various market movements, whether it's an upward trend or a downward trend. In this video I'm going to explain to you a pattern that
[00:44] these patterns, for example, pregnant woman, pennant, flag, is [snoring] shoulder, head shoulder, is much more out of use nowadays, because it doesn't have as high an accuracy rate as it did in the past. Today there's another standard
[00:58] video. I'll explain how it works before we get into the to any market. Whether you want to trade the American market, the Forex market, the crypto market, the B3 market, here in Brazil, mini-index, stocks, any
[01:11] universal pattern. So it doesn't mean that here in Brazil we operate and in the There are many Brazilians who operate there, and many foreigners who operate here, so really want to learn how to trade, folks, we'll have three upcoming
[01:26] classes for you to choose from, so you can find the one that best suits you. This week I'm , on July 21st. Registration is open. Hey, at the end of the month, on the 28th, at 29:30, there's the D3ON online live course, okay? With me, you can
[01:40] redo as many as you need, as long as they're on the screen. And on the 28th, actually on the 28th I in-person immersion course here in Curitiba, which is four days with Suda operating live description so you can get in touch. The phone is also on the screen,
[01:54] today's video, and remember to like, subscribe to the channel, and turn on notifications so So let's get to today's video. Hey everyone, stick around until the end because at the very a huge surprise for you, right? Free content to help you
[02:10] right? Let's get to today's video. Inside bar, the foolproof technique of the trend. So, for those of you who day trade, this type of strategy is a simple one; it's a strategy where you can identify both
[02:27] where you can identify both bearish and bullish start trends, is that clear? Like any other technique, nothing is 100% effective. Everything has its pros and everything has its cons, right? Let's continue. Ensar candle, what
[02:42] assets can be traded? Mini- index, mini-dollar, SP500, index, mini-dollar, SP500, currency pairs, commodities, as well as Forex, crypto and stocks, also in Brazil and the United States. Remember that for those who trade
[02:56] stocks, I always recommend trading with longer timeframes, at least on a daily chart, okay? If you enjoy swing trading, at least a daily chart is recommended for you to start using
[03:10] these techniques, okay? So, at least in terms of indicators, no indicators at all, just candlestick reading, or just bar reading, or also candlestick reading, right? So, it's a very simple reading that you
[03:25] can apply to any market, okay? Following this line of thought, candlestick reading is a school of analysis that can be done by anyone, whether an advanced trader or a beginner trader, also known as price action. Simplicity works,
[03:41] video, the more things you put on your chart, the better and more accurate it becomes, and always minimize the number of screens, okay? So this is very important. The less screen time you have, the better it is for your health
[03:57] Because I've already done it, I've already operated with six screens at the same time, right? Including my laptop. Uh, that really triggered my Meniere's syndrome, didn't it? right? So much my Meniere's syndrome, didn't it? right? So much stress, so much excess,
[04:11] ended up causing me to be unable to operate for three months due to the vertigo I because this can harm your health too, okay? We will always respect and take care with risk management, as this is equivalent to 80% of our
[04:27] trading, okay? 80% of our trading is driven by emotion and risk management. You need to know how to limit your daily risks and pursue specific financial goals. For example, when I started, I
[04:42] aimed to earn R$100 a day, and when I lost, to lose R$80 to R$100 at most. When I started losing R$80 to R$100, I would close my trades for the day and switch to a simulation account. I didn't have a demo account, but I was going to test it out back
[04:56] So this ended up making my analyses easier and facilitating my understanding of that particular market, okay? So, based on our interpretation, right? So that was the turning point.
[05:09] From the moment I started earning more, and when I started losing, right? Even if I kept my success rate at 50 or 60%, I'd still be a profitable trader, okay? So whenever you're going to trade, always limit your
[05:22] risk, okay? This type of operation, folks, aims to find the ideal entry point to track the start of an upward or downward trend. The analysis, as I told you, can be applied
[05:36] to any asset in the world, whether it's Forex, B3, the American market, CRI, and so on. You can use confirmations from other indicators or readings to make your entry more direct, right? You can use, for example, a
[05:49] slow stochastic indicator when the market is moving sideways, to identify where it has reached a top or a bottom. You can use, for example, a VOAP (Volume-Weighted Average Price) as a reference to see if the market
[06:02] is too cheap or too expensive, because the VOAP is the volume-weighted average price, which is the average price of the day. If the price is significantly higher than VOAP, the market is expensive. If it's too low, it's cheap.
[06:15] it's too low, it's cheap. But as I always say, nothing is so cheap that it ca n't get cheaper, and nothing is so expensive that it can't get even more expensive , okay? One piece of advice I always give you guys is to read a lot of
[06:27] books, right? And also, my practical part, is whether your entry, practical part, is whether your entry, your setup, your reading comes in. your target, you already know what you want from the trade, you've already studied everything, then go for it
[06:43] , because when you lose or when you win, especially when you lose, you'll learn the hard way. Nobody likes to lose money. When you lose money, you think: "Oops, something's wrong here. Let's
[06:57] start studying." So you start getting your butt off the couch to start money. Because when you're winning, you always talk, right? If it ain't broke, don't fix it, right? So you have to be careful about that in order to start
[07:12] directing and diversifying that part of your investments. OK? So, folks, how do the entries work? Everything will depend on the formation of only two kenos. The target will depend solely and exclusively on your stop loss. Therefore,
[07:28] our target will always be proportional to our risk. The stop loss is set at the low or high of the inside bar candle, depending on whether the order is to buy or sell. Norton, but what is an inside bar, what is an inside candle? Okay, everyone, I'm going to explain
[07:42] what an inside bar and an inside candle are. Let's go. Here we have two candles, okay? I left it in blue here because can be white, it can be green, or it can be red. It doesn't matter what color the
[07:55] children are. I left a generic color so you wouldn't get confused, OK? So let's go . This candle here, I'll call it candle number one. And this candle number, which in theory would be
[08:07] candle number two, I'm going to call this candle number i, which is the inside bar candle. So this smaller candle here, if you look closely, smaller candle here, if you look closely, its high and low are within
[08:21] its high and low are within the high and low of the previous keno pattern. So, this first keno pattern, its high and low are within the high and low of the following candle. So this next candle that's inside is
[08:34] practically being swallowed up by the previous candle. The candle that's being swallowed is the inside bar candle, because the high and low are within the high and low of the previous candle, okay? So, this is a very important point that you can
[08:47] use within your strategies, within the market. So this is considered a candle inside a candle, okay? Hey Norton! I've identified what the inside bar is, okay? So what do I do now? Let's go, everyone. Let me just
[09:01] delete this for you guys. I'm going to erase all the paint here. Uh, we have an entry and purchase option here, okay? Entry and purchase. Note that after the K inside bar pattern has formed, the candle following the inside bar must be the
[09:16] next one; it absolutely has to be the next candle. Note that the next candle is the residing bar; it breaks the high. So the green candle here breaks the high of the previous candle. So the
[09:31] green candle is breaking the high of the inside bar candle. In other words, from this moment on, when it breaks the high, you will execute a market going up, right? We want the market to move upwards.
[09:45] So that's the point. The moment the next keno breaks the maximum of the inside bar, that's an entry point. Beauty? I identified the entry point. Where will our stop loss be? The stop loss will always be proportional to the
[09:59] chart data, always based on the chart pattern. It could be either at the low of the inside bar or at the low of the knoll before the inside bar. If you are a more conservative person, I would leave it at the low of the candle prior to the inside bar, which
[10:14] we have and candle number one. Remember when we were number one? So people little bit of leeway, at least sometimes, in the mini-index (100 points) and for those who trade the SP500, about 4 points
[10:26] . I always leave that aside. Why? To avoid what's called a "whistleblowing" that move. He goes up, takes you out of the operation, then goes for your target. This happens quite often, okay? Quite a lot, actually. That's why I recommend you
[10:40] always leave a little extra space there to avoid this kind of problem. So let's assume that our stop loss here is at, for example, 10 points on the SP500. Our target needs to be at least 10 points to justify entering the
[10:54] trade. This applies to those who also operate in the Brazilian mini-market, even in the crypto market or currency pairs; it always has to be proportional to the asset you are trading, okay? So that's the buy signal. The
[11:07] sell signal is the same signal, the same trigger, the same inside bar, the same thing. trigger, the same inside bar, the same thing. you can go short and then try to buy cheaper later
[11:22] , right? Regarding the stop loss, you can place it at the high of the inside bar, which is the one I marked with an "i" here, okay? Or, more importantly, what happened before the inside bar, okay? I usually leave them higher up on the inside
[11:36] bar, right? But if you want to make it a little bigger or place it in a So we'll see what our stop loss is there, for example, at five points on the SP500. Our target needs to be at least five points to make
[11:50] this type of strategy worthwhile. I usually do more buying operations, okay? Because I don't know, statistically speaking, that in the purchase it's more assertive, okay? Because I believe that many people don't know that you can do
[12:05] can do that when you're buying something, right? So that must be why it happens, right? Regarding this, folks, this type of operation can be performed on any timeframe. I
[12:17] usually use the 5- minute chart for day trading. The longer the timeframe you use, the greater your chances of making a profit, but the potential for losses can also be greater, right? right? Those who trade on daily charts sometimes experience
[12:29] greater losses than those who trade on 5-minute charts, because the patterns and bottoms are different, right? Yes, and even those who want to use Fibonacci projections to determine a target are welcome to do so. I'm not a big fan,
[12:43] but it's usable, right? Let's now look at our graph. Let's go now. Once you understand how the Inside Bar or Inside Candle pattern works, it becomes easier to apply it in practice. Remember that
[12:56] you can apply to any market. I'm using a platform called Ninja Trader. It's an American platform, okay? With customer service in okay? I'll leave the link here in the description. This platform is completely
[13:09] unregulated coverage; it's regulated in the United States, okay? you right here. I'll provide the Ninja website link in the description deposit, you don't need to deposit anything, you don't need to do anything, okay? It is not necessary.
[13:23] in, right? I'll leave the link in the description; click here to get started. Clicking here on "get started" will bring up the menu, right? Okay, you're going to type in your email. So, I'm going to type nteste.com here.
[13:36] any documents, but you'll receive the email, then you go to your email and inside the email, and it will unlock the platform for transfer anything. If you want to trade in a real account in the future, then yes, right?
[13:51] But in the beginning you can test a simulator there, and for those who register with Ninja, I'll Fibonacci Course. It's a fully paid course here tonight, but I . Just send a message to ms here. I already have Norton working perfectly, I've already
[14:05] fine. Send it to me here and I'll send it to you so you can grant access, okay? And So let's go, everyone. Let's analyze the market, analyze the trends. First of all, you don't trade inside bars when the market
[14:18] is moving sideways. You only trade when it's trending, okay? Okay, zoom in here. If I zoom in here, I'll zoom in on this area here, because the market is in an upward trend, right? If you look here,
[14:31] this candle here is very similar to a shooting star, right? That's what people call that my mouse is hovering over, this one is a candle side bar. This one I'm looking at you want, I can change it here. And here you can see, well, that the assets here in the
[14:45] day. So you can trade at night, you SP5 kendo, you can trade many different assets if you want, directly here as well, okay? Okay, so here, this candle here is an
[14:57] work? See how many inside bars there are? This one is here, and this one is inside this one. So, that's two inside bars in a row, which is awesome, right? In some cases, it even works better. And in this case, how did it
[15:10] work? The next candle, which is this red kendo here, look. If you look here, okay? Hey, let me just grab this here, look. Hey, let me get this for you guys here. I come here, click here, I'll click, I'll create a line, right? And here,
[15:22] look, if you look here, folks, this red pipe here, it broke the minimum pressure on the inside bar, right? He broke the low of the sidebar, giving a sell entry, which would be your chance to position your sell here. You
[15:34] can place your stop loss here, if you want, at this high, or a little whipsaw. And calculate in terms of points here, [clearing throat] folks, roughly around 36 points down to roughly around 30 points here
[15:46] on the NASDAQ for stop loss. My stop gain, ideally, is always equivalent, at least one to one, right? He's more or less here, look. To be more or less here. We were lucky that he caught the stop game on the next candle. This rarely
[15:59] happens, okay, guys? It's quite rare for it to most of the time the market is just sitting there in a lull, right? It goes up, it goes down, up, it goes down until it catches a movement, catches a trend, right? So, everything's very, very calm
[16:14] for example, "Ah, Norton, I can drag my stop, for example, my trade moves towards the stop-in, for example." I don't find that interesting, guys. We have the software, if you ever want to test it, it's
[16:28] this software right here. Want to see? Let me grab the website here. This software is really cool, guys. It's called Welf Lab, okay? . It's free, you don't need to pay anything. Sure, if you want the top-of-the-line version,
[16:41] free trial, as he calls it, right? No credit card required. Yes, you input a strategy and it performs a backtest for 10, 15, 20, 30 years. This website is really cool . Just click on "offlab" and it will appear there. It's good that you
[16:55] can then do a backtest. And I did several backtests using inside bar to see if I moved the stop loss or stop game during the trade, after I entered the trade, right? Your success rate drops by 80%, right? So leave it at that,
[17:08] looking at the graph like that, okay, great , right? It triggered the stop-loss order quickly, and sometimes when the market starts to slow down and move be patient. The worst thing that can happen is that you lose money. The
[17:22] worst-case scenario is losing money, okay? You know, man, North, man, the traffic is kind of heavy here. 30 points on the NASDAQ here translates to about 15 points when trading a micro-lot, as we call it, right? A microcontract, which is the
[17:35] smallest possible lot, right? More or less. Oh man, PR is tough. Wait, it enters the shorter time frame. I'm on the 1-minute chart, right? In a 1-minute chart, the accuracy rate is lower than in a 5-minute chart, okay? The 5-minute chart
[17:47] is ideal. But going back to the example here, he took this, gave another bar rehearsal the previous one. The next candle broke the low, triggered a stop-loss sell order slightly above that high, and the target was basically one to one, right? Pretty interesting [snoring]
[18:01] too, huh? Hey, come on , let me clean this up. Let's 1-minute chart, right? Let's grab this, change this, see? A 5- minute chart, for example, look. The 5- minute chart, guys, you can see there's a
[18:13] us to see. Let me grab the zoom tool here. Catch this movement here, look. Oh, here we have the inside bar . Esse can inside bar. The next candle broke through the high of the inside bar.
[18:26] Here, look. Oh, that green candle broke through the high. Stop losa. I can position it a little below this minimum here. Hey, a little further down here. Previous low bar and proportional target one to one. To reiterate, right?
[18:38] Today was a really great day, was n't it? The market came in, it caught the stop game really common to do that. So it's good that you understand this part too, okay? OK, guys, awesome! So you can trade here if you want to do a
[18:51] backtest, okay? On the demo account, right? You can buy it, you can sell it, right? Market, bought it here, look. I bought it so you could get an idea, right? My profit and loss are already showing up here, right? Oh, the fee is much lower, right? Yes, there is, there isn't,
[19:04] United States, right? No brokerage firm provides this. Yeah, but the rates are much lower over there. Proportionally, it's cheaper to operate there than to operate in Brazil, right? So, I can click to close the operation. I closed it. Then you minimize the graph here, see?
[19:17] All the operations you've performed are already showing up here in their menu, right? And here we have the market monitor, right, the market analyst. You can see various assets there with real-time quotes, including oil, gold, the Dow Jones, NASDAQ,
[19:30] the S&P 500, and everything else right here. Bitcoin is also available here if you want it whoever registers just needs to download the platform, okay? It's all there, just free. Today, the course, which costs R$450, is being offered to
[19:44] watched. Don't forget that all three courses start American market opens on the 21st. The link is in the description so you can participate live online as well, okay? Thank you all so much, and we'll see you soon in our
[19:58] Thank you all very much. Leave a like, subscribe, and see you in our next lesson.
⚡ Saved you 0h 20m reading this? Transcribe any YouTube video for free — no signup needed.