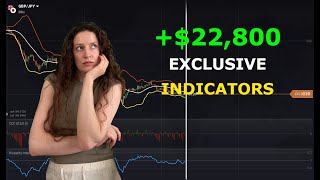

Secret Indicators for Trading
36sThe promise of undisclosed indicators creates curiosity and high click-through rates.
▶ Play Clip"The title promises 'best indicators' but delivers a basic, thinly explained strategy with no proof of profitability."
This video presents a trading strategy for IQ Option that combines three technical indicators: Consecutive Candle Count, Disparity Index, and Bollinger Bands. The creator demonstrates how to configure these indicators and apply them to identify entry points in currency pairs, emphasizing that all three must align before opening a trade.
Set the indicator to count consecutive candles, with both bullish and bearish counts set to 0.5.
Increase the period to 20, keep SMA, change the main color to blue, and thicken the lines.
Set the period to 17, deviation to 2.5, change the middle line color to white, and thicken the lines.
Use pre-selected currency pairs marked with a star in the 'Options and Blitz' section.
For a downward trade, the candle must be below the white middle line of Bollinger Bands but not touch the lower yellow line, staying between the two.
For an upward trade, the candle should be above the white line and not touch or cross the upper red line.
The more consecutive candles in the direction of the trade, the stronger the signal. Ideally, two or more candles should be in that direction.
The blue line of the Disparity Index moving down is a signal for downward trades, especially if it is in an extreme downward trend at the moment of opening.
Using any indicator alone is pointless; all three indicators must give a signal simultaneously, otherwise, do not open a position.
The method is not used on currency pairs with high volatility, as it is rare for the method to work in such conditions.
The strategy requires strict confluence of three indicators and is best applied to low-volatility currency pairs. Trading remains risky, and the creator advises caution.
What are the three indicators used in this trading strategy?
Consecutive Candle Count, Disparity Index, and Bollinger Bands.
00:16
What settings are used for the Bollinger Bands in this method?
Period 17, deviation 2.5, middle line color white.
01:01
What is the rule for opening a downward trade with Bollinger Bands?
The candle must be below the white middle line but not touch the lower yellow line.
02:14
What does the Disparity Index signal for a downward trade?
The blue line moving down, especially if in an extreme downward trend.
04:28
Why is it pointless to use these indicators separately?
All three must give a signal at the same time; otherwise, no position is opened.
05:08
On which currency pairs should this method not be used?
Pairs with high volatility.
05:23
Confluence is key
Emphasizes that the strategy only works when all three indicators align, a core principle for risk management.
05:08Avoid high volatility
Highlights the importance of market selection, a practical tip for traders.
05:23[00:00] Hello everyone! Today I'm going to show you a very powerful method that I recently discovered. I use two different indicators when trading that you may not even heard of.
[00:16] I start by setting regular 1 minute candles and also set the opening time for 1 minute. now I start setting up the indicator called consecutive candle count I set
[00:35] both the bullish and bearish candles to 0.5 and save it. The next indicator that I rarely use in my method is disparity index let's increase the period to
[00:55] 20 let's leave SMA here change the main color set it to blue and make the lines thicker say
[01:08] the last indicator of the method is one note bollinger bands here it is let's increase the you at 217 deviation 2 change the middle color and set it to white thicken up the lines and save and
[01:35] finally I open new asset options and bleeds here I have the best currency pairs which I have already pre-selected and marked with stars so that that's it
[01:54] combination of three very cool indicators have been created and the best currency pairs have been set
[02:07] uh guys i think i found the first entry zone at a very good moment and opened the position in the dollar direction first of all i look at the middle right line of the bollinger bands it must be
[02:21] caused by the candles of the downward direction. If I open a position in the downward direction, the candle should be below the white line of the Bollinger
[02:33] Bands and should not touch the lower yellow line of the Bollinger Bands. That is, when opening a position in the downward direction, the candle should be in the middle of the white and yellow lines of the Bollinger Bands. So that's the role of
[02:51] the Bollinger Bands in this method and everything is going so well I think I gonna win Great It so good to have the first successful trade
[03:06] Here I open a position in the upward direction because they are kind of moving above the Bollinger Bands line and have not touched or crossed the upper red line.
[03:21] so that first signal is good the second signal is given to me by this consecutive candle count candles they must be in the upward direction and the more candles in this case are made in
[03:37] the upward direction the stronger the signal now when I open a position it is better if two or more candles are made in the direction in which I'm opening the position in this
[03:52] case it's the upward direction and as you can see great it's so cool that I successfully completed my second trade I think I found another great moment and I
[04:14] got crazy I went into downward direction as you can see the red candles are moving below the white line of the Bollinger Bands three consecutive candles in the down direction also gave me a signal For the blue line of the disparity index when it comes down or starts moving down this will be a signal
[04:43] from the disparity index. It's better and I think it's very good if it's in an extremely downward trend at the moment of opening a position. Cool! Cool! I
[05:01] recorded three successful trades out of three trades. Friends, no matter what indicators I have discussed in detail, using each of these indicators
[05:16] separately in this method is completely pointless. All three indicators must give me a signal at the same time, otherwise I don't open a position. I also don't use
[05:28] this method on currency pairs with high volatility because there is rarely a method that works in such cases. So if you liked the video be sure to like it
[05:42] and I hope you learned a lot of interesting things about trading. Also remember that trading is not easy and it's quite risky, unfortunately. I wish you
[05:55] Successful trading day and see you in the next video. Thank you so much




⚡ Saved you 0h 06m reading this? Transcribe any YouTube video for free — no signup needed.