
Bots Are Attacking Your Site!
60sReveals shocking bot activity on a small website, making developers curious about their own site's security.
▶ Play Clip"The title promises a monitoring tool overview and delivers exactly that with real data and honest comparisons, though the sponsor bias slightly inflates the score."
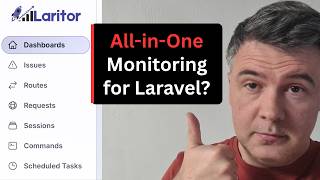
This video is a sponsored review of Larator, a monitoring tool for Laravel applications. The presenter demonstrates its features using real data from his website, AI Coding Deal, and compares it to Laravel Nightwatch, highlighting its ease of setup and comprehensive monitoring capabilities.
Larator is a tool to monitor Laravel applications from all angles, tracking requests, queries, jobs, logs, and more. The presenter has been testing it for a few weeks and shows real numbers and charts.
Larator is presented as a strong alternative to Laravel Nightwatch. The video is sponsored, but the presenter has followed the product's development and its author, Srinath, on Twitter.
Installation involves signing up, installing a package, getting API keys, and running 'larator sync' after deployment. Optionally, you can send more metrics. The presenter tested it on his website with a few hundred visitors per day.
The dashboard shows requests, sessions, most active users, total jobs, cache events, queries, and average query duration. It integrates with Laravel's user model and sessions. An example shows a peak of 975 database queries in an evening, prompting investigation.
The 'Issues' section tracks 404s and bot requests. The presenter notes how many bots attack websites, including Feedly and NewsWire, and feels important with his small website.
Routes show most popular routes, average duration, and P95, filterable by days or hours. Requests are similar but include statuses and charts, also showing 404s and hacking attempts.
Sessions can be clicked to see what a bot or user did. Artisan commands show scheduled tasks, status (healthy or not), and failures.
Jobs show details and insights like duration and average wait time. Exceptions are tracked, with an example of a unique slug exception. Larator acts as an exception tracker.
Database queries are tracked, and logs from Laravel's log file are viewable. All this data is available with almost zero configuration, just by installing Larator.
Cherry-on-top features include DB schema, health checks, feature flags, custom events, and alerts (e.g., on exceptions). These require additional configuration.
Larator sends emails for exceptions and a weekly performance snapshot PDF, which can be presented in meetings.
Documentation shows environment variables to enable/disable features, max events per occurrence, filtering events, ignoring specific requests, and redacting sensitive data like email addresses and IPs. You can also add additional info for authenticated users.
Larator offers a free trial with 300K events. The $20/month plan includes 20 million events. The presenter's usage projected to exceed the free trial but stay under $20. A comparison page shows Larator gives more events for the same price as Nightwatch, but Nightwatch supports deployment tracking.
The presenter appreciates the builder's story, noting Larator started in '24, before Nightwatch, and has been actively developed. He encourages trying the free trial and supports the passionate builder.
Larator is a comprehensive, low-configuration monitoring tool for Laravel that delivers on its promises, offering a wide range of features at a competitive price. The presenter is genuinely impressed and recommends trying it, especially for small projects.
What is Larator?
A monitoring tool for Laravel applications that tracks requests, queries, jobs, logs, and more.
00:01
How do you install Larator?
Sign up, install the package, get API keys, and run 'larator sync' after deployment.
01:12
What is the free trial event limit for Larator?
300K events.
06:27
What does the $20/month plan include in Larator?
20 million events.
06:44
What feature does Nightwatch have that Larator doesn't?
Deployment tracking.
07:54
How can you redact sensitive data in Larator?
By registering a redactor to hide or redact email addresses, IP addresses, and other user details.
06:00
What email notifications does Larator send?
Exception alerts and a weekly performance snapshot PDF.
05:13
Zero-config monitoring
Larator provides extensive data with almost no configuration, making it easy to adopt.
01:44Comprehensive data collection
It tracks everything from queries to logs, offering a complete view of application health.
04:29Competitive pricing
Larator offers more events per dollar compared to Nightwatch, making it a cost-effective choice.
06:27Builder's passion
The product's history shows dedication, which can be a factor in choosing a tool.
08:39[00:01] show you a very useful tool called Larator to monitor your Laravel application from all possible angles. So, when the home page says connect everything that happens in your Laravel application, it's pretty much
[00:16] everything. Look at the menu items on the left. I've been trying Larator for a few weeks now and I can show you real numbers, charts, and entries what Larator can do. So, if you're currently using something like Laravel Night Watch
[00:30] or similar service, Larator is another alternative and a pretty strong one. And disclaimer, this video is sponsored by Larator, but I've been following the journey of the product and its author, Srinath. I hope I pronounced it
[00:43] correctly. So, here's him on Twitter and this is a fascinating story of a person genuinely going deeper with the product trying to deliver a very useful thing for the community. So, let me show you what's inside and how you can use
[00:57] Larator and what are its advantages over something like Laravel Night Watch. So, sign up on their website. This is the documentation and then you follow the installation guide which looks like this. It's pretty similar to Laravel
[01:12] Night Watch and other similar services. You install a package, you get your API keys, and then you put Larator sync after deployment and also optionally you can send more metrics which I did in my case. And I've tested it on my website
[01:29] AI Coding Deal .com which gets like a few hundred visitors per day and these beginning of this video. So, in addition to the default dashboard of requests and sessions and most active users, which is important because it integrates with
[01:44] your well, Laravel everything, user model, sessions, and stuff like that. Then we can scroll down and see more metrics on the dashboard like total jobs, requests, cache events, queries, and average query duration. and you for
[01:58] example may take a look and see some weird peak here and yesterday's evening there were 975 database queries for some reason and you may start investigating. Then let's briefly go through the menu items. So
[02:13] issues with 404s here. Also interesting thing here is bot requests. So those are tracked as well. So I realized how many bots are attacking the websites at the
[02:25] Feedly is still alive with three subscribers. That's cool. Then Net subscribers. That's cool. Then Net NewsWire and others. So I felt even I felt important with my small website with this one. Then routes. What routes
[02:40] are the most popular and average duration and P95 and you can of course filter by days or hours in this case. Requests is a bit different from routes. Requests is a bit different from routes. In a way similar thing but with statuses
[02:55] and with charts visually and also you can see 404s here and again trying to hack in a way. So looking at those lists and charts, this is another proof how many automations we have these days, bots and crawlers and malicious things
[03:11] on our website. Then there are sessions for example and I can click on any session and see what that bot actually was going for. So it got only to one page but maybe others non-bot users would go for more. So I can open my own
[03:27] session where I was browsing through benchmarking and this is how you get those results. Then there are artisan commands which some of them are in the of them are in the scheduler and you can see again how much does it schedule
[03:44] tasks. This is almost the same thing and also status healthy or not healthy and if there are failures here as well. Jobs. So I'm using another system called demonstrate in another video on this channel. So, jobs from that one and
[04:00] processed. Let's see. Those are the details about specific jobs and also job insights. This is interesting. Insights about specific job and duration and average wait time and stuff like that. Exceptions. Pretty recently, I got one
[04:15] exception with unique slug, I remember. So, Laravel is also an exception tracker. Then database queries. This is a typical thing for such tracking systems. So, yeah, the data is here.
[04:29] What else? For example, logs. You can view the logs from your Laravel log also here. So, all of that from just installing Laravel and enabling that. So, I didn't actually enable manually anything. And this is kind of the point
[04:42] and advantage here. Almost zero config system with a lot of data based on your Laravel application. And a few things kind of cherry on top. So, for example, you can have DB schema here. You can have your health check. And those are
[04:57] activate it with additional configuration. There are feature flags, which I don't have in my project. You can add custom events and alerts. For example, alert on exceptions. So, yeah, a lot of things. In addition, you get
[05:13] emails like this for exceptions. So, it's exception tracker again with more details. And also yesterday, I released this email, which I didn't even know I would get. The period and weekly performance snapshot, which looks like
[05:29] this. Interesting PDF that you can present during your meeting to your that, there are quite a few customization options. So, here in the documentation, you can have environment variables with enable or disable
[05:43] something or, for example, max events per occurrence. Also, you can filter stuff. So, what events to log or not to log. There are a lot of available overrides, like ignore specific requests, like these ones. Also, for
[06:00] personal data or sensitive data, there's redacting, so you can register redactor, which would hide or redact email addresses, IP addresses, and other user
[06:12] details like this. Or you can go the opposite direction and add additional information for authenticated user, like user ID, something specific. This is also possible. And now, let's check the pricing page and compare to something
[06:27] like Nightwatch. So, here's pricing. Free trial, 300K events, which may be a lot or not a lot, depending on your project. And then the price may look similar to Nightwatch, $20 per month for 20 million events and then extra per
[06:44] events. But, what is an event? For all those things that I've shown you in this video, how many events did I get? So, this is my billing page and currently I'm on free plan, but the author assigned me 1 million events. But,
[06:57] assigned me 1 million events. But, during this period, I received that many events per day or per month, and this is probably the main number, projected end of month event usage. So, I would run out of free trial. On this case, it's
[07:11] out of free trial. On this case, it's not 300,000, it's more. But, the usage is pretty stable and then I would pay $20 for this month, which again contains 20 million events. So, I would totally not jump over $20 per month. And we can
[07:27] actually compare that pricing to Nightwatch. So, Laravel creator smartly added a separate page comparison against Nightwatch. And of course, he is biased and of course, he will say everything that it's best Laravel Nightwatch
[07:42] alternative and Larater gives you more. So, it's a bit too salesy in my opinion. And of course, in head-to-head capabilities, he will emphasize what
[07:54] Larater has, what Nightwatch doesn't have. But also, there are things the deployment tracking is supported by Nightwatch and not supported by Larater. So, it's pretty fair. But in terms of pricing, there's the calculator. But in
[08:09] general, let me zoom that in a bit. Nightwatch for $20 per month gives 7.5 million events at the time of shooting this video, and Larater gives more for the same $20 per month. And then there's calculator at the bottom, which with
[08:25] default values like 500K requests per month, and these numbers are pre-filled. And it shows, of course, again, very good move from marketing and sales point of view, it feels like Larater is cheaper than Nightwatch. But this comes
[08:39] if you are over $20 plan on Nightwatch. And the final note about Larater is changelog and about page, and I do want to emphasize. I like the stories of the builders, and by using Larater, you will
[08:52] support a builder who is really passionate about what he does. So, this is the changelog with new things appearing in August and in July. So, pretty active. But also, in about section, the story behind why Larater
[09:07] section, the story behind why Larater exists, and it started way back in '24. So, it's not vibe coded, it's not a one-shot thing. It has been around for, well, a few years now. And it started even before Laravel Nightwatch, the
[09:21] idea, the initial commit. But the release was a year after, and the first paying customer was a few months even later. And now it feels like Larater is ready for expansion, and you may participate in that. So, go to
[09:35] larater.com. As you saw, free trial for 300k events is available and try it for yourself on some small project. I was personally pretty impressed. Again, this video is sponsored by Larater, but I'm genuinely impressed. I'm trying to be
[09:49] unbiased reviewer on this channel, but in this case, I don't have anything bad to say, to be honest. It just works. What do you guys think about such tools in general? What are you use? Are you using Nightwatch, other competitors? And
[10:03] what do you think about the future and potential of Larater? Let's discuss in the comments below. That's it for this time and see you guys in other videos.

⚡ Saved you 0h 10m reading this? Transcribe any YouTube video for free — no signup needed.