
The 'Master Line' That Predicts Mini-Index Moves
43sReveals a seemingly magical trading line that accurately predicted Friday's move, sparking curiosity and FOMO among traders.
▶ Play Clip"Title promises easy money but delivers a vague, low-detail chart walkthrough with no concrete strategy explanation."
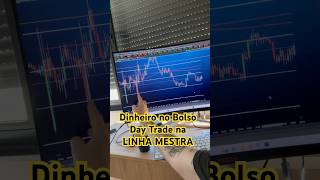
This video presents a day trading strategy for the Brazilian mini-index (mini-índice), centered on a 'master line' (linha mestra) drawn on the chart. The trader explains how this line, updated weekly, signals profitable entry points and highlights the current key level of 178,015 for the upcoming week, alongside a low-volatility dollar.
The master line, a dotted line on the mini-index chart, is presented as a key tool that puts 'money in your pocket' when followed correctly.
A specific example is shown where buying at the master line led to a profitable trade, demonstrating the strategy's effectiveness.
The main theme for the week is the master line, which has moved from 174,800 to 178,015, indicating a new key level to watch.
The line is drawn based on the pivot point from the previous Monday (the 13th), where the price made a low and then a high, establishing the line's position.
Tuesday and Wednesday were noted as complicated, with the market feeling like Thursday, suggesting increased volatility or uncertainty during those days.
The dollar is trading at 5,143, moving within a 20-point channel with very low volatility, indicating a stable but quiet market.
The 'adjustment' line, shown as a bottom line on the screen, is highlighted as crucial to keep on the chart for clarity and to avoid confusion.
The video emphasizes the master line as a reliable guide for day trading the mini-index, with the key level of 178,015 set for the week. Traders are reminded to watch the adjustment line and the low-volatility dollar, and to engage with the content by liking and commenting.
What is the 'master line' in the context of this video?
A dotted line on the mini-index chart that signals profitable entry points for day trading.
00:02
What was the master line's level last week and what is it now?
It was at 174,800 and is now at 178,015.
00:28
How is the master line drawn?
Based on the pivot point from the previous Monday, where the price made a low and then a high.
00:43
What is the current price and volatility of the dollar?
The dollar is at 5,143, moving within a 20-point channel with very low volatility.
01:28
What is the 'adjustment line' and why is it important?
A bottom line on the chart that helps avoid confusion and is crucial to keep on screen.
01:58
Master Line as Profit Tool
Establishes the core premise of the video: the master line is a direct path to profits.
00:02Key Level Update
Provides a concrete, actionable number (178,015) for traders to watch.
00:28Dollar Volatility Assessment
Offers a clear market condition snapshot (low volatility, 20-point channel) useful for trading decisions.
01:28[00:02] lot of money in your pocket. It's a line in the mini-index called the master line. That dotted line you see here, look. Just take a look. This happened on Friday. This line was drawn last Sunday.
[00:16] None of that had happened. And look , if you had bought it here, look. I operating, look. Lua bought it here,
[00:28] same thing. And now I'm going to give you the main theme for this week. Well, the main line that was at 174800 is now at 178015.
[00:43] We're going back to last Monday here, which was the 13th. That's how it's here, which was the 13th. That's how it's drawn. Although there were more trades here earlier in the day, we traced here, at the point where it
[00:58] hit, made this pivot, right? So, there was this candle that made a low at this candle that made a low at 178,015. Then there was this other candle here that made a high, and before falling from that high... Well, looking at
[01:13] Tuesday, things got pretty complicated at that point. Looking at Wednesday, it also point. Looking at Wednesday, it also felt like Thursday, right? So, that's the main topic for felt like Thursday, right? So, that's the main topic for this week in 178015, okay
[01:28] this week in 178015, okay everyone? And the dollar is at 5143. Oh, I made this low, I made this other one here, it went up, I made this high, so it stayed here in the 20-point channel, it held on, the dollar is like this with very low
[01:46] volatility, right? There were quite a few here, right? And then we'll see how the behavior went. Oh, those candles are really small, aren't they? Oh, it's holding the
[01:58] adjustment here. It's also very important to have the adjustment on the screen. This bottom line here is the adjustment. So, just so there's no confusion, okay? Here, look. I remembered her well here at the okay? Here, look. I remembered her well here at the end of the week too. Wonder. Don't
[02:12] forget to leave your questions and a like! Until the next video.




⚡ Saved you 0h 02m reading this? Transcribe any YouTube video for free — no signup needed.