

Tech Stocks Crash 11%! Market Panic
45sDramatic market drop with specific numbers grabs attention and triggers FOMO.
▶ Play Clip"Delivers a solid trading strategy but padded with lengthy market recap and course promotions."
This video provides a daily market analysis for Brazilian traders, focusing on the mini index and mini dollar. It covers global market movements, including tech stock declines, and offers a detailed trading strategy for the 5-minute chart using moving averages and MACD.
Tech companies, especially AI infrastructure, semiconductors, and memory, fell sharply, with some dropping nearly 11%. The Nasdaq fell almost 3%.
The PMI came in above expectations, showing economic strength and reducing recession fears. However, potential interest rate hikes from September keep the market cautious, as higher rates typically lower stock prices.
The mini index opened with a strong gap down of 1,300 points but recovered to rise 3,000 points. The dollar opened with a gap up and reached 5.20.
Gold fell 0.74% to $4,130, silver dropped nearly 3%, and Brent oil fell 1.44% to $76.85, a positive sign due to reduced geopolitical tensions. Bitcoin fell nearly 3% to $62,660.
Vale fell 1.95%, while Petrobras rose 0.87% despite oil's decline. Itaú, Bradesco, and Banco do Brasil all rose, keeping the index positive.
Marcos Massuda announces upcoming trading courses: a live online course on June 30 and July 1-2, and an intensive 'Imersão de Trade' from July 28-31 with 25 hours of practice.
The mini index opened with a large gap down but recovered at 10 AM, rising 3,400 points. Entries were made on pullbacks and moving average crossovers.
A direction candle triggered a buy on the breakout of its high, with a stop loss below the candle (R$125 risk) and targets at the first or second VWAP band. The trade succeeded, yielding nearly R$200.
The market becomes more lateral in the afternoon with reduced liquidity, making trading more difficult.
The Pure Coach indicator shows the previous day's adjustment, which serves as strong support/resistance. In today's rise, it acted as a target for stop gain, allowing a 200-point gain.
Using the Renko chart and the 'Ondas de Choque' setup, several pullback entries were possible during the trend, yielding 3-4 entries and meeting the daily goal.
The creator spent a year mastering pullback trading, learning optimal times, VWAP band importance, and exhaustion zones. VWAP bands are the strongest support/resistance levels.
The mini dollar was lateral, moving only 30 points, below the ideal 40-60 points for trend trading. Historically, it moves 85-100 points. No crossover entries occurred.
In lateral markets, scalp trading is ideal but not recommended for beginners. The creator uses a longer stop loss and averages down, requiring advanced skill.
Global markets fell overnight due to AI-related tech stocks. The S&P 500 fell ~1%, Nasdaq ~3%, while the Dow Jones was flat. European indices also declined.
Gold fell sharply and recovered little, complicating long-term trades. Silver fell 2.57%. The creator advises monitoring support levels and limiting losses to 30%.
Brent oil fell to $76.87, a positive sign due to reduced geopolitical tensions. Iron ore recovered slightly in pre-market, but Vale still fell.
The creator uses EWZ (Brazilian ETF in NY), DXY (dollar strength), and the 10-year Treasury yield to predict the Brazilian market opening. A negative yield is positive for Brazil as it attracts foreign investment.
The creator recommends TradingView via EasyMarkets for real-time access to international assets, with a link and tutorial in the description.
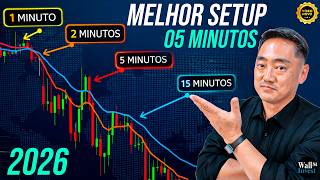
The strategy for 5-minute charts uses pivot point breakouts (high/low) and is suitable for trend reversals and strong trends. It works for both mini index and mini dollar.
Use two exponential moving averages (9 and 21 periods), VWAP, and MACD histogram with settings 55, 12, 9. Add horizontal lines at 50 and 25 to gauge trend strength.
Wait for the price to break above the 9-period MA and form a first higher high (pivot). Enter on the breakout of that pivot or on a pullback to the 9 MA. The MACD should be above zero and above the 5-period MA for confirmation.
The creator demonstrates adding the 9 and 21 EMAs, configuring them, adding the MACD histogram with custom settings, and adding horizontal lines at ±25 and ±50 for visual trend strength.
On June 17, a strong downward move after a lateral period triggered a sell entry on a pivot breakdown, capturing 750 points to the third VWAP band.
The video provides a comprehensive market overview and a specific, actionable trading strategy for 5-minute charts, emphasizing the importance of technical indicators like moving averages and MACD for identifying trends and entry points.
What are the two moving averages used in the 5-minute strategy?
9-period and 21-period exponential moving averages.
15:56
What is the MACD histogram configuration recommended for the 5-minute chart?
55, 12, 9.
22:50
What do the horizontal lines at ±50 on the MACD indicate?
Above +50 indicates strong bullish trend; below -50 indicates strong bearish trend.
24:03
What is the entry trigger for the 5-minute pivot strategy?
Breakout of the first higher high (pivot) formed above the 9 MA.
16:38
What is the ideal daily movement range for the mini dollar to be tradeable?
85 to 100 points.
08:42
What does the Pure Coach indicator show?
The previous day's adjustment, used as support/resistance.
05:10
What is the recommended stop loss for the 5-minute pivot strategy?
Below the pivot or the entry candle.
03:44
What does the MACD histogram being between -25 and +25 indicate?
The market is lateralized, without a clear trend.
18:38
AI Tech Selloff
Highlights the fragility of AI-related stocks and their impact on global markets.
Trade Entry Example
Provides a concrete example of a successful trade using the strategy.
03:44Pure Coach Indicator
Introduces a specific indicator for identifying support/resistance levels.
05:10Strategy Configuration
Gives exact settings for indicators, essential for replicating the strategy.
15:56MACD Strength Lines
Explains how to use horizontal lines to gauge trend strength, a key visual aid.
24:03[00:02] technology companies plummeted sharply, dragged down by companies in artificial intelligence technologies, especially memory, and AI memory, which fell by almost 11%. The
[00:16] United States, the Nasdaq, which is the main index for Gologia companies, fell by almost 3%. Today, the PMA (World Wide Area) was also released, and it came in above expectations. This shows that the economy is stronger, thus pushing away the recession, but
[00:29] the scenario of a possible return to rising interest rates from September onwards still leaves the market cautious. Remember? If interest rates rise, the stock market falls. Here in Brazil, the Mines index opened with a sharp drop of 1,300 points, but soon
[00:41] recovered and rose by 3%, reaching 3,000 points. The dollar opened with a gap up and a slight, sluggish rise, reaching 5200 today here in Brazil, okay? In this scenario, the S&P 500 is down 1%, the Nasdaq is down 2.57%
[00:57] , in Europe, the German DAX is down 0.83%, and the European index is down 1.39%. As for gold, it continues to fall, down 0.74% to 413, and silver has fallen almost 3%. Brent crude oil also fell, which is a positive scenario because the
[01:12] is much calmer; it's down 1.44 to 76850. That's very good. And the iron ore from a recovered pre-market is rising 0.46%. Bitcoin continues to fall almost 3% to
[01:26] 62,130, causing considerable concern among cryptocurrency investors. Here in Brazil, Vale's stock plummeted, but its shares rose. Vale fell 1.95%, but Petrobras, even with the drop in oil prices, rose 0.87%, Itaú 0.37%, Bradesco 0.90%, and Banco do
[01:41] Brasil 1%. With that, the Bovespa index remained positive at 0.4% at 1716 and the Salta mini-index rose 0.36% to 174105. The mini-dollar
[01:53] rose 0.36% to 174105. The mini-dollar also closed higher at 0.85% at 5200. . And in today's tip, yesterday I showed the best strategy for trading the 15-minute chart. And by popular demand in the comments, today I'm going to
[02:06] share the best trading setup for operating the 5-minute chart to trade the mini-index and mini-dollar futures. Hi trader, how are you? Marcos Maçuda and Lula today's lesson with two important warnings. Next week, on
[02:19] Wednesday and Thursday, my online live course, "Dayet ao Ponto," will be held with me, Marcos Maçuda. And at the end of July, from July 28th to 31st,
[02:31] the highly anticipated day trading immersion will take place. And the class is almost full, hurry up and secure your spot. It's the kind of course where I spend 4 days with the student, 25 hours a day from 9 am to 7 pm, and 70% of that is live practice in a preg session . Information about two courses is in the
[02:46] description of this video. We are here at the mini-index on the 5-minute chart. Today's situation is very similar to yesterday's. Yesterday the price dropped, it's small, it plummeted sharply, but then it rose 3600 points. Today he woke up
[02:59] with a large gap, 1300 points. It dropped a little more, but at 10 am it shot up 3,400 points. Let's take a look here, shall we ? The index surged today and remains high, just like yesterday, because the stocks stayed
[03:12] high, okay? So, look, it dawned with this gap here, a strong gap down here of 1300 points, it even dropped a little more and then at 10 little more and then at 10 am it recovered, went up 2800 points,
[03:24] then started going up again and now it's way up there . In this scenario, there were some intersections. Let's take a look here . At the intersection of the 5- minute averages, he gave this intersection here this morning. Since it opened with a gap,
[03:38] moved sideways and then started to rise, crossed the moving averages, and formed that 15-point candle, an ignition candle, right? I logged in, oops, let me put my password here because I had to update Profit again. Now yes. Let me bring some
[03:50] more over here. Now yes. So, this candle here was the irrigation candle, right? Entry on the breakout of the high, stop loss below the candle, a very expensive stop loss of R$ 125 with a target here at the first band, at 75 or even the second
[04:04] band. In this case, it worked, the stocks rose sharply, but at the beginning, the price started to show signs of hesitation, indicating indecision in the giving up on the operation. Those who stayed calm, because the stop wasn't triggered, let it go
[04:20] and grabbed this lovely entry of almost R$ 200 here, right? That beautiful climb. started to rise again due to a breakout, managing to reach another target here at the third band. We were live with the students here from 11 am to noon, and in that
[04:34] scenario, that climb was very tedious and painful to tackle. It wasn't easy not to catch. And then this crossover happened where he managed to catch another short sell entry here to grab another 200 points, right? And then a new
[04:46] purchase entry looking for the third band there. It's a scenario I don't crossing operations. Then the complicating operations, which is natural in the afternoon, right? The market
[04:59] is more like half, but liquidity drops significantly, causing the market to become more stagnant in its movement, okay? And today we're highlighting POR Coach, right? from yesterday, right? For those who are chartists, adjustments are a valuable
[05:12] way up, he had great difficulty breaking through that region. Even the students commented: "Oh, it's holding on to the worst coach, right? It's trading per coach, right? And target for stop gain, right? So it entered, went
[05:24] short here, exited on the adjustment and managed to get 200 points there, okay? OK. So today was even good to trade. Now, in this nice climb here, entries through PBEC. Let's take a look here, at the Renco 10R, right? And the
[05:40] shockwave setup. Look here. Starting at 10:30, it began a trend, made two or three entries here, then the price reversed, there. In the second band, you know it's very difficult to break through. Then
[05:53] it went down, made another short entry here, a couple of entries. On its return, it made other entries here, but when it reaches the band, it uses the band as an exit target, okay? It waits to break through to then get a good position." Okay, let's get some new entries
[06:05] here, okay? It wasn't as pretty a scenario as yesterday, but if you know how to trade pullbacks in a trend, and you follow us daily here using the at least three or four entries and
[06:17] secured your goal for today. It wasn't easy, but it was possible. Okay? Let's trade pullbacks are focused. I spent a year trading only this strategy. So, , I started to understand the good times to trade, the importance
[06:33] of the VAP bands, that when you get there you have to wait for it to break through to buy again or sell if the price is falling, right? So movement metrics, exhaustion regions, and that these bands are the
[06:47] market today. And if there's an adjustment along the way, be even more attentive, because it's also a good resistance that people use a lot as support and resistance, okay? So today the index was good to trade. Guys, if you're
[07:01] forget to give it a like. Like the video and if you're not subscribed, subscribe to the channel and become part of this big family. Remember that I upload three videos every day . At 8 AM, I give you a 2.5-minute analysis of the index today, presenting a
[07:14] scenario of what could happen today, bringing you the main news and how At 5 AM, I can see how things are doing abroad to try and predict today's movements. At 11 AM, there's a live stream here on YouTube
[07:27] where I do a full analysis of the trading session, live, and answer your questions. And at 5:30 or 6 trading analysis, where I analyze the day's entries and always give you an important tip . Oh, my friend. Why is it important for me to see what happened? To
[07:41] best way to trade, to practice, sorry. For example, watch the old classes; I've been recording every day for over four years . Watch the old classes, see the entries that were made... Take the market replay, take that day, watch
[07:55] the segment where I show the entries for the index or the dollar, take the replay of that asset and try to pick those entries. See the traps and the good entries that occurred that day so you can start practicing with focus. That's
[08:09] the goal of trading. Always practicing with focus so that when you trade your operations. Let's take a look now at the mini-dollar. And the mini-dollar that more tricky scenario to trade in, okay? If the index opened with a
[08:23] sharp drop, the dollar opened with a sharp drop, right? Almost 0.6%, 30, that's 30 points up. And the market is very sideways, few movements, look, movement of 20, right, 15 points. For me, it's a sideways market, okay? For the dollar
[08:38] above 40. Ideally, above 60 points, okay? So, in the day's metric, Historically, the dollar has to move between 85 and 100 points. So, these days, the dollar is quite difficult to trade. The market is very sideways, with very few
[08:53] weren't any entries on the crossover today, okay? There weren't any entries on today's crossover. sideways market is difficult to trade. Now, uh, the pullback too, the pullback is a trend that requires a trend, right? Renco 3R, shockwave setup. Look, there were
[09:08] but the trades were also very slow, okay? Also interspersed with some stops. In this more sideways market scenario , the ideal strategy is scalping, beginners, but look, today, as the market was very sideways, there were beautiful entries
[09:24] turns that the price makes to the average, this yellow line, which is a 21-period moving average. So use this pink line here, it's the Kelter channel, right? Where it hit outside, "It hit inside, I catch those turns giving good entries. Yes, it's a more
[09:38] aggressive strategy, it's a strategy with short targets, which is called scalping, right? And with a stop. So the stop you can, like this, there are two schools that defend scalping, the shorter stop loss or the longer stop loss. I'm from the school that
[09:51] average the price. That is, this strategy is for those who already know how to trade price movement and who only trade when the market is more sideways. Let's take a look at the international markets. I 'm here on the Trading View platform from
[10:05] Easy Mark and like this, look. Last night, starting at 11 pm, the international markets plummeted sharply, as I said, due to companies linked to artificial intelligence technology, mainly companies linked to
[10:18] infrastructure, right, memories, semiconductors, boards, everything that involves technology and artificial intelligence, always this distrust, right? that, like, look, these companies even went up 200, 300%, so the
[10:31] scenario is, it's not that this distrust is causing people who have already made too much to start closing their positions to realize profits, right? So there's always a little correction happening, OK? So there was a
[10:44] pretty strong correction today in the SP500, and now the market was trying to rise at fell again at this moment, totaling almost a 1% drop in the SP500, okay? The Nasdaq, well, it fell even harder, almost 3%, and now
[11:00] the Nasdaq continues to fall, okay? The Dow Jones, the Dow Jones consists of 30 classic industrial companies, it doesn't have technology, so it suffered less. There was a mess here at 10:30, but it's rising and at this moment it's at 0 to 0, okay? In Europe,
[11:14] Germany also fell sharply and is now recovering 50% of its fall to a 0.74% recover much more strongly here. Right? Now, gold, gold is
[11:26] complicated, isn't it, folks? It plummeted sharply yesterday too and recovered very little today. It 's complicated. Remember when you were on vacation it was at 4500, it reached you were on vacation it was at 4500, it reached 5600 and 418. It's really complicated for
[11:40] longer-term operations, okay? Because I've been positioned for quite a while, my operations, not only mine, but many people's here. So it's time to analyze the market and see if I'm going to trade , that is, if I'm going to buy more
[11:54] to adjust the average or if I'm going to accept the loss and exit, okay? So always pay attention resistance, and important lows losses exceeding 30%. Then you have to
[12:07] accept the loss or trade, which would be buying more to adjust the average price, okay? But it's not so easy to make the decision. Silver, Because it's more volatile, it plummeted even further and continues to fall, currently down 2.57%. And
[12:20] Brenton oil, well, at least some good news, continues to fall. It was at good news, continues to fall. It was at 7.78 yesterday, 77 today, and fell to 76.870, right? With this and this more positive scenario regarding the war between the
[12:33] coming. Of course, every now and then there seem to be some, you know, some squabbles, but the outlook is more positive . The strait is open, lots of ships are passing through, and with that, oil is returning to the price it was before the
[12:47] war, below 80 per barrel. Okay? That's a positive scenario today with a drop of 1.42. And iron ore, which was also falling sharply today, recovered somewhat in pre-market trading and is currently at 0.46, but
[12:59] even so, Vale fell sharply today, okay? So, folks, and have access to Bitcoin, I have access to the EWZ. Every morning when I record the index today, I analyze the EWZ. What is the EWZ? It's the Bovespa index
[13:12] in New York. And at 5 AM there's already the pre-market, which is this light gray bar. I have the after-market and the pre-market. So I can see in the morning how the Brazilian market is doing abroad and with that predict the opening
[13:24] of the index here. Look at the importance, right? I also have access to the DXY, which is the strength of the dollar. It's the dollar relative to currencies like the euro, the Japanese dollar, the pound , the Swiss franc, okay? So you see it and it's positive, meaning, with this
[13:39] scenario the dollar has strengthened. And also important is the 10- year treasury, the 10-year interest rate, okay? Here, at negative 0.27. It's a good scenario for Brazil, which is why foreigners come to operate in emerging markets, which is Brazil. An
[13:53] emerging country. OK? So, right now it 's negative, it was even more negative, . So, that's the important thing. What else do I see here? I see Vale's ADR in New York, Petrobras, Itaú, Bradesco. So, in the morning, before the
[14:06] Brazilian stock market opens, I'm already seeing how these stocks are being traded in the American market, and with that I can try to predict the index's movement today, okay? So, that's how I do the index analysis today, by analyzing
[14:18] international markets, okay? If you also want to have access to the main assets in real time and even trade in the international market, I a link to this TradingView platform in the description of this video, which is the best platform for the
[14:30] international market and the crypto market, TradingView is free through Easy Markets. There you have real-time access to these assets, okay? And also below that link there's that I recorded that shows you the step-by- step process to access this
[14:44] platform. And in the tip of Today, yesterday I presented the best strategy for trading on the 15-minute chart. Today, at your request, I'm going to show you the best For those who follow me, you know I like to trade moving
[14:57] average crossovers quite a bit, but there's another strategy that might be very interesting for you traders: the breakout of bullish and bearish pivots . It's a slightly more cautious strategy that can give you
[15:09] more assertive entries, okay? So, let's go to today's lesson: the best day trading setup for the 5-minute chart to trade mini-index and mini-dollar. When should I use this setup? It's for reversals of
[15:23] long-term trends and trend movements. That is, either when the price is rising sharply or falling sharply, or when the price has risen sharply and reverses into a major trend. So, either in trends or in major reversals, okay?
[15:36] The trigger will be the breakout of bullish and bearish pivots. I'll show you exactly how on the chart. This setup works. It can operate on both the Mini-Current Assets and the Dollar. This strategy, for those who follow me, has a
[15:48] different configuration for the international Forex market. For the Brazilian day trading dollar index market, it's in this configuration. 5-minute chart. Here I will work with two moving averages, one of nine periods and one of 21 periods,
[16:01] always exponential at the close. And of course, I always include VPFA Bands in all strategies, which for me is the best support that exists today, and of course the best support that exists today, and of course the MAC dystrogram in the 55 269 configuration,
[16:15] placing a five-period moving average on top. And here, pay attention, pay attention, in a very important tip: horizontal lines at 50 and 25 to see the strength of this trend and also a standard 2 MV coloring. Let's take a look now at how
[16:30] make the explanation clearer, I removed the VWAP and VAP BS, which I will use as stop-game triggers, OK? So here, this blue line is the nine- period moving average and this yellow line is the
[16:43] 21-period moving average, okay? How does that work? Does this strategy work? I'm going to wait for the breakout of the nine-period moving average and the first peak formed, which would be the bullish pivot. So, for example, today the price had a strong gap and was down, then it moved sideways, and
[16:56] strong gap and was down, then it moved sideways, and then, look, here it has already broken the 21-period moving average, indicating the beginning of a trend. So, at this first peak here, it would be possible to enter, but the most correct thing to do is wait for a clearer peak formed
[17:10] above the blue moving average, which is the nine-period moving average, okay? And here, look, it cannot break the blue moving average, the nine-period moving average. In this case, it respected the nine-period moving average and formed this first peak. This first peak here at the beginning of this
[17:24] bullish trend is the famous bullish pivot. So I'm going to enter on the breakout of this pivot. So, when this pivot breaks, I'm going to enter long here, in this region, or I'll wait for a correction, which would be exactly the entry by backing. So I have two
[17:39] entries: enter here or wait for a possible correction that coincided with the nine-period moving average, which in the case of the 5-period chart... pullback moving average, where the price tends to respect these averages more. So, in the 5-
[17:54] minute chart, the tip is to use the 9-period moving average instead of the 21-period moving average to trade pullbacks, right? broke through, what does that mean? That the price will continue to rise. And then I can make a buy here or wait for it to break through this one, right? And enter for the pullback. And
[18:10] then I took this rise that occurred exactly at the third VOP band, which I'll show you on the chart . Below is the famous MAC of the histogram, right? This yellow line is the five-period moving average to show me
[18:22] strength. And also these lines here, blue and red, show the 25 and 50 lines, okay? What does that mean? If the histogram, as it is here, is between the two red lines, 25 and 50, the market is more sideways.
[18:38] Now, when it passes the +50 region, it means there's a strong trend. And if it's above this yellow moving average of nine , it's going further. So here, from here on, it shows that I can go long and extend the operation to
[18:52] going to work this strategy, okay? So, and here I still have Nothing. It's a 921 crossover, a classic, right, from the literature of
[19:04] let me repeat again here, I expect this pivot to form, which is the first top formed above the moving average of nine, okay? It can't break the 9th moving average. And in my entry, if it 's above the 21st moving average as well,
[19:21] even better, it shows a strong trend, okay? Let's take a look here little top here. Want to see? It had made this top here. It broke the moving average of the The average was nine. Here it broke through with a slightly
[19:35] stronger wick, but it would have been enough to enter here. Ideally, you should wait for the price to also break through the 21-period average, which is this yellow line. So I wouldn't go long here, but rather long here to catch this upward movement. So I would have
[19:48] already made an entry here before, and then a third entry, this one shorter because it was already in the third band region and the MacDiid was already showing weakness, showing divergence, right? Tops rising, MacDiid
[20:02] falling, divergence, possible price reversal. It's just that the price then stopped okay? But let's take a look now and set up this strategy on the chart. Let's go. So I'm here on Profit today, on the mini-index on the
[20:15] put the two moving averages, here on this button, insert indicators, more indicators, right? I choose here, see, the moving average, select it and I'll insert it on Chart. First, I'm going to add the famous nine-period moving average, OK? Oh, the nine-period moving average is already inserted
[20:32] . And now I'm going to insert the 21-period moving average. I click the insert button and now I put 21 periods, which is the second moving average, okay? Two lines here, the nine-period moving average and the 21-period moving average. Let's click OK here, right? And now I'm going to configure these two
[20:46] averages, okay? First, I'm going to select the average that's closest to the price, which is the smaller one. I selected it. When I selected it, this menu appeared. Go here to settings, properties. And now here, it's a nine-period moving average, always
[21:00] difference between an arithmetic and an exponential moving average, put it in the comments and I can make a lesson just explaining why the exponential moving average is better than the simple arithmetic one, okay? I always use an exponential moving average.
[21:13] I don't change the offset. So it looks like this: Parameters: nine-period moving average, nine periods, exponential type, appearance: I'll leave it in light blue , blue. Sure, right? And thickness two to make it more visible. Values are
[21:26] always the closing value. Here in the asset I'm not going to change the time frame. OK? The first average is configured . Now I take the second average that is further away from the price, which is the larger average, uh, settings. And now
[21:39] here, see, period 21, exponential type. Appearance. I'll leave this in yellow. Yellow. You can leave it in red, yellow, whichever you want, okay? Values too. Closing and asset
[21:51] here. I don't change. Apply. OK. Done, it 's configured here, right? So, look here, see. It broke the 28 average, broke it again. And then it made the first bullish pivot, which was the buy entry here to catch
[22:05] this 1000-point rise here. OK? Now let's put the MACD histogram. Insert indicator, more indicators. Tip: don't take this one, which is the MACD line histogram, right? Go here to search and type
[22:18] MACD and get it. Just the histogram, okay? This histogram line is very So just take the histogram, which is prettier. It can't be placed on the chart, only in a new window. Insert new window. Okay. Now here, look,
[22:32] it's ugly, orange. Let's make it nice. Let me remove this I'm going to change the settings, look. I selected here, look. I selected, go to properties. Long average is default. 269. I'm going to change it to 55, 12, I change it to 26 and
[22:49] the 9 remains, okay? Appearance, how I'm going to add a color, always leave it on white, because when you add a color, if there's color, it can the color to white when you add a
[23:01] color. Okay? Done, now it looks nicer. I select again. Properties, right-click, insert moving average, the five-period average, okay? Look here, Oh. I'm also going to change this average to exponential, always
[23:16] exponential, it's better. And I can also leave it in yellow for... Give it more prominence, okay? To give it more prominence here. OK. There, it's yellowish. Now let's add some color to this Mac. Right-click on the mouse. Okay, I selected it.
[23:30] I selected the right mouse button. Place and insert coloring, take the 2 MV standard. There you go, your MACD looks colorful and great now . And to add those horizontal lines, which are very important in the MACD, look here. Click here on the zero in the
[23:43] corner, right-click, properties, price scale. You come here, right here, to the fixed gate, directly to the fixed gate. And here in the horizontal grid fixed gate. And here in the horizontal grid , I'm going to put, look, 50 include,
[23:55] , I'm going to put, look, 50 include, -50 include, 25 include, and -25 include. Okay , so at 50 and -50 I'm going to leave them in blue, because above 50 (positive)
[24:09] it's an upward trend, and below -50 it's a selling trend. And I'll leave the 25 and the -25 in red. Why red? Because if it's between 25 and 25, it means it's moving sideways, without a trend, okay? This is
[24:23] to help visualize it, yes, yes, it's to visualize this here. So, when the price is moving sideways, for example, yesterday, right, at the end of the day it remained sideways. Look at the colorful MACD. And between the red lines,
[24:35] 25 - 25. When a strong trend begins , look, it passes the plus 50 region showing a strong trend, okay? So, the tip is that this first peak, this first upward pivot formed, and the Maid also has to be above
[24:49] the zero axis, indicating an upward trend. With that, I can this trend can be broken at any time . Today, for example, the price rose 3400 points, showing a beautiful upward trend towards the bands. Of course, we're always
[25:04] trend towards the bands. Of course, we're always including the VOAP bands here; this includes the daily VOAP bands as well as the VOAP bands for you to operate on. It's a bit messy at first, but you get used to it eventually. So, in the beginning, if you want to remove the
[25:16] bands, do it to make it cleaner and just see the midrange frequencies more clearly, right? For example, these days too, oh, yesterday the price went up very quickly, I ended up not being able to make a band. So, it didn't end up being an entry point here, look. But, look, on
[25:31] June 17th, look here, the price went up, stayed there, and then it made this strong movement here, right? Look here . He broke through the averages, he made this low here, below the average, he had already made this same low here, right? It
[25:47] price was sideways, it was dangerous. Wait for the strongest movement to happen. Okay , so it formed a bottom there, and then when it broke out, you went short and caught it up to the third band. Ah, but the price dropped even more, it could have captured all
[26:00] this movement here, look. 2000 points, no, it goes up to the third band and then you finish here. 750 points, goal achieved, my friend, that's great. Even though the MACD gave the correct conditions, right? Oh, the McD needs to be below the nine moving average, that
[26:14] yellow moving average, and below -50, indicating a trend of strength, right? So this is a strategy that I really like for those 5 minutes. Tomorrow I will show you the five-minute setup works so that you can also choose between the two
[26:26] 5-minute chart. Hey trader, did you like today's tip? Japa a like, and if you're not subscribed, subscribe to the channel and become part of this great family. Like, share, big hug, and see you in the next class.



⚡ Saved you 0h 26m reading this? Transcribe any YouTube video for free — no signup needed.