
AI Summary
Mangesh, a self-described professional trader, presents his proprietary mathematical trading method for intraday trading in Nifty and Bank Nifty. He claims his approach, which relies solely on price and square root calculations, can predict market tops and bottoms with high accuracy. The video is a mix of a trading tutorial and a promotional pitch for his paid classes.
Chapters
Mangesh introduces himself as a professional trader, not a blogger, and acknowledges his videos are crude. He emphasizes content over presentation.
He states his core belief: 'price is everything' and 'price is an indicator from God.' He trades without indicators, using only price and mathematics.
He clarifies his method is not related to Gann's methods, but his own developed approach.
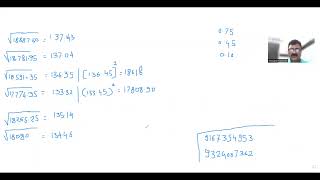
He introduces the concept of using square roots of prices to find support/resistance levels. He suggests using the square root function on a mobile calculator.
He shows a Nifty daily chart with prices around 1779 and 17774, asking which indicator predicted the market rise. He claims his method can make exact top/bottom statements.
He mentions that when price comes close to certain decimal values (0.75, 0.45, 0.10) after square root calculations, it signals a reversal. He hints at additional conditions to be explained later.
He gives a specific example: price 18591.35, square root 136.35. He predicts a final move above 618 (likely 136.18?) and the market going up.
He checks the 15-minute chart on December 5th to verify his prediction. He notes a candle above a certain level.
He shows price reaching 136.82, close to 136.75, and claims this predicts the top. He multiplies 136.75 * 136.75 = 18700, and indeed the market opened down the next day.
He states the method is valid for Nifty and Bank Nifty, but he is still researching for individual stocks.
He applies the same logic to predict lows, using the example of 1774 and expecting a low near 17.5 (likely 17500).
He notes that on December 23rd, price crossed 17808 in a few minutes, leading to a straight up move, similar to previous days.
He mentions a recent high of two days ago, and calculates its square root: 18000.265, square root 135.14, which is his level.
He claims he doesn't need open interest data; he trades naked options with a capital of 20000.
He advises that option selling is not suitable for the average person, implying his method is for buying options.
He promotes his professional classes, stating that with his method you don't lose at all. He mentions his knowledge is his own and not SEBI approved, but he is SEBI certified.
He provides his phone number (91673) and WhatsApp for those interested in learning mathematical trading, and mentions his Telegram channel link in the description.
Mangesh presents a mathematical trading method based on square roots of prices to predict market tops and bottoms, primarily for Nifty and Bank Nifty. While he provides examples and claims high accuracy, the video also serves as a promotional pitch for his paid classes, with contact details provided.
Mentioned in this Video
Tutorial Checklist
Study Flashcards (5)
What is the core belief of Mangesh's trading method?
easy
Click to reveal answer
What is the core belief of Mangesh's trading method?
Price is everything; price is an indicator from God.
00:36
What mathematical operation is central to his method?
easy
Click to reveal answer
What mathematical operation is central to his method?
Square root of prices.
01:17
Which key decimal values does he watch for in square root calculations?
medium
Click to reveal answer
Which key decimal values does he watch for in square root calculations?
0.75, 0.45, 0.10.
03:20
What does he claim about the method's validity?
medium
Click to reveal answer
What does he claim about the method's validity?
It is valid for Nifty and Bank Nifty, but not yet for individual stocks.
06:54
What is the example of squaring a predicted level?
hard
Click to reveal answer
What is the example of squaring a predicted level?
136.75 * 136.75 = 18700.
06:20
💡 Key Takeaways
Price is Everything
Establishes the foundational principle of the method: price alone is sufficient for trading decisions.
00:36Key Decimal Levels
Reveals specific numerical triggers (0.75, 0.45, 0.10) that are actionable for traders.
03:20Exact Top Prediction
Demonstrates a concrete example where the method predicted a top at 18700, which was followed by a decline.
06:20Scope Limitation
Honest admission that the method works only for indices, not individual stocks, setting realistic expectations.
06:54Full Transcript
[00:05] welcome to Mangesh Mathematical Trading. I am appearing before you after a very long time, after 4-5 months. First of all, I would like to say that I am not a professional blogger, I am a professional trader, so my videos will appear quite crude to you. I know
[00:23] that they are crude, but I have no objection to that because what content am I giving you, what is the most important thing for me. Let's start. I
[00:36] completely believe that price is everything, price is an indicator from God, that is why everything, price is an indicator from God, that is why
[00:49] I trade without indicators and that is why and that is why my trading is mathematics.
[01:04] say again that it is not even remotely related to the method of Gann. It is not. Okay, it will be great. This is my own method.
[01:17] I have developed this method. I will tell you a little about it in 5 minutes. If you want to find the square root of any number, you can find the square root
[01:32] symbol in your mobile, the icon of the square root. And any price of Nifty And any price of Nifty
[02:14] like it happens here, I will show this, this is the daily chart of Nifty, the price was 1779 for two days chart of Nifty, the price was 1779 for two days on 30th December and 17774 on 26th December, on 30th December and 17774 on 26th December, which indicator was telling you that the
[02:28] market will go up from here, this is my question, put any bet, take it
[02:42] from here, take it from there, it will come at 61% etc., all this is a matter of discussion, I am saying this, this is a matter of discussion, I will prove this in the live market, how can you make an exact top or bottom statement, we will start from here,
[03:20] how much is 187.60, 137.43 what did I say, whenever it comes close to 0.75 0.45 0.10, there are two-three more conditions in it, I will tell you all about them later because in the video it will become very big, there is no benefit in making it big,
[04:25] anyone could have told how much it is, see this level people how much is 18591.35.18 91.35 how much is 136.35, I
[04:51] after making a punch final move, it will go above 618, the market will go up the most, let's see what actually happened, let's market will go up the most, let's see what actually happened, let's see, the date was
[05:05] 5th December, let's go to the 15-minute chart and see what happened on 5th December,
[05:37] candle is above it, at
[06:20] comes to 136.82, means, what did it come close to, do it, 136.75 * 136.75 18700 do it, 136.75 * 136.75 18700 18000, absolutely you can predict the
[06:33] top and bottom of the market, see 18700, it opened straight down the next day, see 18700, it opened straight down the next day, opened straight down the next day But if you
[06:54] absolutely yes, this type is valid, it is valid only in Nifty, Bank Nifty, in other individual scripts, I am still searching and trying, whenever I find it, I will definitely tell you all about it. All these that I have taken here,
[07:09] definitely tell you all about it. All these that I have taken here, all these highs are 91 low, now we have also seen this 1774, all these highs are 91 low, now we have also seen this 1774, now we will see that after this, whenever a low now we will see that after this, whenever a low is formed in the market, okay, can we say
[07:24] is formed in the market, okay, can we say that these people are make, you will see 17.5, what is the nearest to it,
[07:58] 1779.5808, see in how many minutes did it cross 17808 on 23rd December,
[08:16] candle closed, straight up from there, straight up from there, this happened on day 30 as well as on day 26, this happened on day 30 as well as on day 26,
[08:38] look at the latest high of two days ago, whatever it was, it was made, this is of two high of two days ago, whatever it was, it was made, this is of two days ago,
[08:59] 18000 265 dashlama 25 its square root is 135.14 what is our level
[09:38] other information about open interest, it is not necessary for me, I trade in naked options not necessary for me, I trade in naked options and everyone can do it,
[09:55] 9:15 am, that Streets that Streets capital of 20000
[10:13] not tell about option selling, a common man cannot do option selling,
[10:26] 20000, at the level at which the market is running, an
[10:43] you do not lose at all in this, so you should also conduct professional classes, I would also like to say that this knowledge is my own
[10:55] saying, hence it is not approved by SEBI and I am SEBI certified I will also tell you that no analysis was done because whoever wants recognition,
[11:07] after learning, if he gets money then everyone would earn money, I will say it straight away, okay, so earn money, I will say it straight away, okay, so this is my phone number, apart from this, please this is my phone number, apart from this, please
[11:20] send the link of my telegram channel in the description below 91673, this is my WhatsApp number, if anyone wants to know about this program or wants to learn mathematical trading, then you can WhatsApp me on this number or call me, thank you.