
Gamma Heat Maps: The Secret to Zero DTE Profits
60sExplains a complex concept (gamma exposure) in an accessible way, appealing to traders seeking an edge.
▶ Play Clip"Delivers on the promise of a 40% return strategy, but the title oversells by omitting the high risk and active management required."
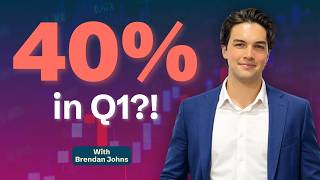
In this interview, options trader Brandon Jones shares his 'Trojan Horse Iron Condor' strategy, a zero DTE (zero days to expiration) approach that returned 40% in Q1. He explains how he uses gamma heat maps to manage entries and exits, capitalizing on volatility and market maker positions to achieve high win rates while actively managing risk.
Brandon Jones introduces his zero DTE iron condor strategy, which he calls the 'Trojan Horse Iron Condor'. It aims to capitalize on volatility premium by selling credit spreads above and below the current price, expecting price to stay within a range during the day.
The core idea is to take a simple, profitable zero DTE iron condor and improve it by using gamma heat maps for exit criteria. He emphasizes that simplicity can be lucrative.
Brandon started with fundamental investing and single-leg options, failed initially, then immersed himself in options math and structures. He has been trading options for about 5 years, learning without a mentor.
The goal is to capture volatility premium by selling credit spreads above and below, expecting price to stay within a range. As volatility increases, the premium on both spreads increases, aiming to compress price within a single day.
A statistical backtest with fixed entry (fixed deltas) and zero trade management returned $22,550 over the past year. This shows the strategy is profitable even without management, but optimization through management can improve it.
The VIX must be between 19 and 40 to ensure volatility premium. Below 19, the bands are too tight. He sells the 8 delta above and below, and buys the 7 delta above and below, opening at 9:31 a.m.
The backtest shows flat periods and drawdowns, with most profit coming later. Management can turn this into a steadier upward curve by limiting drawdowns and identifying unfavorable days using gamma heat maps.
He almost always uses SPX because it is cash-settled (no assignment risk) and highly correlated with VIX gamma, which is useful for heat map analysis.
He uses platforms like Vol Signals to view notional gamma exposure. Red nodes indicate negative gamma (market makers short gamma, forced to buy, accelerating price), green nodes indicate positive gamma (market makers long gamma, forced to sell, decelerating price).
Market makers aim to be gamma neutral. When price breaches levels where they are long gamma, they sell off positions, causing deceleration or reversal. When short gamma, they buy, accelerating price. These levels act like support/resistance.
He adjusts his iron condor bands to capture large green nodes (deceleration areas) within his bands, because theta decay will make his options more valuable as price stalls. He wants to enclose as much deceleration as possible.
He mentions other platforms like Spot Gamma and Mentor Q. He also considers macro conditions, such as news events, and avoids trading on days with high-impact news or Fed speeches.
He trades every day if VIX is above 19, but skips days with major macro influences or Fed speeches. He emphasizes the need for top-tier intraday management due to unpredictable events like presidential tweets.
He typically uses a 10-point width between short and long strikes. This gives higher premium but larger max loss. When VIX is higher (24-30), he may use 10-width; when lower, he reduces width to maintain separation.
Tight width (10 points) limits max loss compared to wider spreads. With a 10-width, max loss is about 7-8 times max win, but with wider spreads, it's even larger. Tight width also helps in managing risk during unexpected moves.
He aims to take profit at 80-85% of max profit, often closing by 1:00 p.m. if chop allows. He uses gamma heat maps to visualize stop loss levels, not fixed prices. If price breaks through key gamma clusters, he exits.
He uses a mental stop loss based on gamma map exposure, not an automatic stop. In 90% of cases, he manages via heat maps; the other 10% are high-impact tweets or macro moves that trigger automatic sells.
If his upper band is at 7055 and price breaks through a significant gamma cluster, he will sell. The time of day matters: at 11 a.m., he might be down 100%, but at 2-3 p.m., he might be down 10% or up 25%, so he evaluates accordingly.
If the market moves against him, he may add debit spreads as a hedge. He enters them early (within first 30-45 minutes) when the condor is up 10-20%, getting a discount. He uses strikes directly above his short and long positions.
He keeps debit spreads on if irregular moves continue, taking them to expiry to offset max loss. If moves normalize, he offloads them around noon, as theta accelerates after 12 p.m.
He may use butterflies instead of debit spreads, especially later in the day. Butterflies pin a specific price and have massive reward-to-risk, gaining value rapidly near expiry. He prefers them after noon.
Time of day is the main factor: before 12:30, use debit spreads; after, use butterflies. Single-leg options are for highly irregular moves with exponential momentum.
A debit spread is buying an option above spot and selling one above it, gaining value when price moves above the long strike. A butterfly involves selling two calls at a pin price and buying calls above and below, profiting if price settles at the pin.
He closes butterflies when price hits the pin, especially later in the day, as they gain value exponentially near expiry. A butterfly opened for $5-10 can pay out up to $450.
The theoretical max loss is 1:7 or 1:8, but with active management, it's typically 1:4 or 1:5. He rates the strategy as an 8 out of 10 risk due to high max loss and need for constant management.
Despite high risk, the win rate is above 90%. Even without management, it would close in profit 90% of the time, but management improves win rate and reduces max loss.
He named it 'Trojan Horse' because it's simple and unexpected, but packs a punch. Iron condors are not complex, but this strategy is powerful.
He has traded this strategy for about a year, honing it in Q1, which returned 40% on the account. He risks 8-14% of the account per day, but active management reduces actual losses.
He collects about $100-150 in premium per contract. Max loss on paper is about $750, but his local max loss incurred is $450. This is a one-trade-per-day strategy.
1) Backtest everything mechanically and anti-discretionary; even the basic strategy was profitable. 2) Understand market maker activity via gamma charts; it's lucrative and goes beyond this strategy.
He recommends VolSignals platform, the book 'Trading Volatility', and research papers from Harvard. He also mentions Mentor Q as an alternative tool.
The Trojan Horse Iron Condor is a high-risk, high-reward zero DTE strategy that leverages gamma heat maps to manage trades actively. With a win rate above 90% and potential for significant returns, it requires rigorous backtesting and constant attention to market maker positioning.
What is the VIX range required for the Trojan Horse Iron Condor entry?
The VIX must be between 19 and 40.
04:23
What deltas are used for the short and long strikes in the iron condor?
Sell the 8 delta above and below, buy the 7 delta above and below.
05:07
Why does Brandon prefer SPX as the underlying?
Because it is cash-settled (no assignment risk) and highly correlated with VIX gamma.
07:33
What do green nodes on a gamma heat map indicate?
Green nodes indicate positive gamma, where market makers are long gamma and forced to sell, causing deceleration.
09:26
What is the typical take profit level for this strategy?
80-85% of max profit.
20:11
How does Brandon manage stop loss?
He uses a mental stop loss based on gamma heat map exposure, not a fixed price.
21:53
What is the difference between a debit spread and a butterfly?
A debit spread profits if price moves above a range, while a butterfly profits if price settles at a specific pin price.
29:59
What is the win rate of this strategy?
Above 90%.
35:06
What is the theoretical max loss ratio for the iron condor?
1:7 or 1:8, but with active management it's typically 1:4 or 1:5.
33:43
What book does Brandon recommend for learning about volatility?
Trading Volatility.
40:00
Backtest Profitability
Shows that even a basic, unmanaged version of the strategy is profitable, providing a strong foundation.
03:13Market Maker Gamma Neutrality
Explains how market maker positioning creates predictable price behavior, which is key to the strategy.
10:09High Win Rate
Despite high risk, the win rate above 90% makes the strategy attractive, but management is crucial.
35:06Backtesting as a Principle
Emphasizes the importance of rigorous backtesting before risking capital, a universal trading principle.
37:56Gamma Charts as a Learning Tool
Highlights the broader applicability of gamma heat maps beyond this specific strategy.
39:19[00:02] and this returned 40% in Q1. Many options traders, myself included, love zero DTE trading, zero days to expirations or day trading.
[00:15] Today we will dig into what our guest calls his Trojan horse iron condor. Welcome Brandon Jones. Hey John, how are you doing today? All good here. Let's
[00:27] get straight to it. Give us the one-minute version of your zero DTE strategy and how it has worked for you. So the one-minute version is what if you could take a simple zero DTE iron condor strategy that's already profitable and
[00:41] just continue to make it better by understanding gamma heat maps for your exit criteria. I guess that's more like a 20-second pitch, but that's uh that's essentially just the bare bones of it. Something super simple
[00:55] can be incredibly lucrative. All right, that's exciting. I look forward to digging into this, but uh tell us first a little bit about yourself, especially as an option trader. So initially I was heavily
[01:08] geared towards fundamental investing. Uh I would just like to buy and hold and and kind of as everybody wants to start, they want to just beat the S&P by buying maybe some blue chips and then take on a little bit of a higher risk profile.
[01:22] And when I first began, I started entering into just single leg options, fully directional plays, and I did not do well at all. And deciding not to do well at all. And deciding not to quit, I just fully immersed into lots of
[01:36] high-level math and and learning under and understanding options, option structures, and how to capitalize uh on on market moves via options. So I would say I have been doing this for
[01:48] about 5 years or so. And I started off with no experience, no mentor, no teacher, and failing a lot to be able to to learn more about how to capitalize off of the options markets.
[02:03] Where you located? I am located in Philadelphia, Pennsylvania. So, a bit of a bit of a distance for me up. Yes, for sure it is. So, let's get to to your strategy. You call it a Trojan horse iron condor. So,
[02:20] tell us first, what are you trying to achieve with this trade? So, I think everybody is somewhat familiar with an iron condor as you are just opening credit spreads both above and below. And you are trying to
[02:34] capitalize off of price staying within a fixed range throughout the day. And essentially, what we're trying to capitalize is as markets get more volatile, we are getting a volatility premium both on the
[02:47] spreads. And we're essentially trying to achieve an effective range that's going to be able to compress price throughout the duration of one singular day. What does this means?
[02:59] So, this means at a very high level, if we were to visualize a chart in our minds, if the SPX is going to open at X price here, what I'm building is a lower band down here and an upper band up here, and I'm
[03:13] determining that price is going to stay within either of my bands. And at the very highest level, I have built a statistical back test that is going to suggest that with very little management, you can find an upper and
[03:28] lower band that will prove with a very high confidence rating that price is going to stay within these bands. So, here, like I said, this is the most bare-bones that you could possibly get with an iron condor strategy. This is a
[03:42] with an iron condor strategy. This is a fixed entry with fixed deltas on our credit spreads. And this is with zero trade management. And what I first wanted to show is this is not me spinning up a bunch of just
[03:57] that doesn't work sound amazing. Over the past year, if you were to enter into iron condors zero DTE with fixed entry and exit criteria, zero trade
[04:09] portfolio, you would have returned portfolio, you would have returned $22,550. nature, and the way that you optimize it is by understanding how to manage it.
[04:23] But Brandon, what are the exact entry and exit criteria you have built into this backtest? So, the first is we are trading volatility. So, my first criteria is the VIX must be between 19 to 40.
[04:40] This is basically so that we are getting that volatility premium that I initially uh discussed. Because when the VIX is trading lower than 19, if you're going to build out your upper and lower bands at the deltas that I'm about to explain,
[04:53] you're going to have much less wiggle room between the upper and lower. And those bands that I discussed, we are selling the eight delta above and and we are buying the seven delta above and below.
[05:07] So, it's essentially we are selling, that's the nature of creating a credit spread, is oops, sorry. Is you are selling the eight deltas above, and then you're going to buy the call right above here, you're selling
[05:20] the eight deltas below, and then you're going to buy the put directly beneath that. So, we are buying the eight deltas and selling the seven deltas here. Our entry criteria is the deltas, as well as our VIX trading
[05:34] within a certain range, and we are opening this at 9:31 a.m. Okay, so right after the market open, if it fits those criteria. Exactly, yep. Or basically if VIX is 19 or above. Yep, pretty much. And then we I I
[05:50] filtered out some of the some of the times when VIX will open around 60 to 100. We are we're we're filtering out hyper volatility. But Brandon, people who look at this backtest may notice number one, it looks
[06:05] pretty flat for long period and it also has a couple of not insignificant drawdowns. And your 20 something percent profit basically all came in the last period. Exactly. And a lot of what has to do
[06:23] with that is your trade management. Because what if you could turn this strategy from kind of a smooth flat line for about 9 to 10 months into a more steady upward curve by one, limiting the drawdowns, and two, identifying days or
[06:40] intraday moves that are not going to be beneficial to your strategy. And the way that we do this is by understanding the intraday gamma heat maps and the market on. Because in in this backtest, you do not
[06:54] not have any management. You just let the trade expire. There's no stop loss, no take profit level. You let the You let the trade expire. Yep. Essentially, this is opening the trade and then I just close my laptop, go get some
[07:07] groceries, go to the gym, play some tennis later in the day. This is zero trade management. You just let everything expire, which is in most cases not how this strategy is going to become
[07:21] its most profitable self. Okay, so let's dig into the details and start with when you enter these trades. First, which underlying are you using?
[07:33] Almost always SPX. Why is that? for one, it's cash settled, so you're not at risk of being assigned and two because in our gamma heat maps, it's highly correlated with the VIX gamma
[07:48] those two uh side by side one with another. Tell us now a little bit more about the detailed entry mechanics because the back test was more mechanical, but you said that you are actually adjusting
[08:02] this. So, go through the process of when you when and how you enter these iron condors. And at what levels? Sure, let me show you just kind of what I'm looking at from my perspective. So, as we take a look at this sample
[08:16] So, as we take a look at this sample heat map, this is a platform run by a group called Vol Signals. Uh they have a free trial for whoever wants to to take subscription. So, as you can see on the left side
[08:29] here, we have notional gamma exposure from a market maker's perspective. So, my target is always to open by selling the eight deltas. As I look at notional gamma exposure, I may adjust that. And that is because we need to
[08:44] mean. So, explain what is explain a little bit in detail what this chart shows us. You say notional gamma exposure, etc. What does all this mean? This basically means
[08:59] where are market makers exposed because gamma is the second derivative of your spot price, which is basically going to tell you the rate of acceleration from options. So, as you know, delta is how much the options premium is going to
[09:13] change based on a $1 move. Gamma is showing you how much the delta changes based on a $1 move. So, it is your acceleration. And as we can see these red nodes, this is showing you negative gamma.
[09:26] But then these green nodes will show you positive gamma exposure. And from a market maker's perspective, that correlates to red nodes show where they are short gamma and green nodes show where they are long gamma per strike
[09:39] price. And what the what is the meaning of the market makers being long gamma and short gamma? What do they have to do in those situations? If a market maker in those situations? If a market maker is long gamma, say we take this 7,025
[09:53] and the size of the node correlates to the extent at which they are long gamma. These are all based on some mathematical functions that are pretty simple to learn. Like this is going to be just a simple GEX exposure equation. But to put
[10:09] that in layman's terms, larger nodes are going to show, like we said, where they're long gamma. So if they are long gamma, market makers' goals are to be gamma neutral. So as we are breaching this level of 7,025
[10:24] and they are long excess amounts of gamma, they are going to be forced to sell off massive positions. And the effect of this with market makers selling off massive positions at levels that you can
[10:36] anticipate and front run, it's going to either decelerate, stop, or reverse price depending on the move, other subtle macro factors, and and and a few other small details. But green gamma can just simply be
[10:50] interpretate interpreted as deceleration. the opposite effect. It means they're short gamma and they are required to buy to remain gamma neutral. So it's going to accelerate price. As at any level you
[11:05] can anticipate in red gamma, market makers are going to be buying and price markets. So can you somehow compare this a long So can you somehow compare this a long reds to a support level and long greens
[11:20] analysis? Absolutely. And if you are watching you have this gamma exposure on another screen, you can watch the direct effect
[11:33] as price enters into these red and green nodes. Whereas if we're trending looking at this chart, price is moving up up up and then we see a large cluster of green gamma or where market makers are long gamma. We are
[11:46] going to anticipate high levels of deceleration or even potentially reversals within this area. Because throughout this entire cluster of also of almost 20 points on SPX, we know that market makers are required to sell off
[12:00] positions continually as we move up. It would be very difficult for price to of time. And then just to quickly relate this back to our strategy, our iron condors capitalize off of theta
[12:14] or deceleration. So the longer that it takes to move through these levels and the larger moves that it requires, theta is going to continually offset these moves and continue to allow our options to become more valuable. So what does
[12:28] this mean when you enter your iron condor at 9:31? That you put the shorts because you said initially that your back test was to put the shorts at eight delta. Yeah, I guess
[12:40] eight delta may not completely correspond to this gamma levels. Yep. So how does this influence how you how you place your iron condor? Because I always want to capture uh as much of the market makers exposure
[12:56] that's going to be favorable in deceleration as I can. So as we're looking at this heat map, I'm going to make sure that I enclose the largest number of these large green nodes within my bands. Because as we just as we
[13:08] >> the time decay is going to make my option more valuable. So if I can find areas of deceleration where price is going to stall out, I want to encapture that within my bands. So if I'm looking at this exposure, I'm going to want to
[13:22] make sure that this upper cluster and this lower single large node is going to be captured within my bands because if we're seeing price accelerate one way or the quicker price moves towards one of my bands, the quicker my option is going
[13:38] to lose value. So, I want to have these deceleration areas captured within my bands. When you say you want them captured, you mean that you want the these areas. >> Exactly. So, if my option initially had
[13:54] the lower bands around 6980, I would manipulate the lower bands to move a little bit lower. I would probably try to capture them at 6945 to be able to have these areas of deceleration captured within because I
[14:08] know that we're going to see large deceleration because jumping from 6970 to 6965, the negative gamma is about 1/10 of the positive gamma that we see there where the effect of market makers selling off
[14:23] positions here is going to be 10 times the effect of the previous at 6970 where neutral. So, I'm going to want to capture as much deceleration as possible because anybody in Iron Condor knows that you love chop.
[14:40] It's everybody's favorite condition when you're in a when you're in a Condor. You mentioned one tool for gamma exposure. There are of course a of same type of data for retail option
[14:54] same type of data for retail option traders. Yeah. Spot gamma, Mentor Q, etc. Just to have mentioned mentioned that. Yep. Yep, there's there's definitely a bunch of different platforms. What other conditions do you
[15:06] platforms. What other conditions do you look at? I look at macro conditions. For um everybody is kind of familiar what is going on in Iran right now going on in Iran right now and the effect of intraday news. So,
[15:21] managing intraday news is is pretty difficult. I'm I'm not going to lie because large macro moves and and high impacts news can have a a much greater effect on the market than than sometimes we realize, whereas
[15:35] we can anticipate acceleration, deceleration, whatever it may be within this gamma profile, but there are just sometimes when that we have. So, we always have to pay attention to
[15:50] the macro scene and you have to execute at a really high level. It's very very fast, very quick. There have been times where I've been in a condor, news will break and there will be a massive ball spike.
[16:02] And being able to manage that while understanding the effect and the lagging effects of that high impact news is is going to be incredibly crucial. Do you put this trade on every day as long as the VIX is 19 and above? Yep. So,
[16:18] generally yes, unless we have larger macro influences, where there have been many times throughout the Iran conflict where we have passed just because of general macro news and then any day when
[16:32] the Fed speaks, we we usually will will take a day off because although the traditional behavior when there are FOMC meetings, it'll generally chop until about 2:00 p.m. Eastern time, it's better for us just to stay away. I
[16:46] guess we cannot take the day off every day the president and tweets though. Yep. Yep. So, that's that's where your intraday trade management has has to be intraday trade management has has to be just top tier. Um so, but yeah, I wish I
[16:59] wish we could know when he was going to tweet. I will say that. I think Manuel Fousseni would love to know would love to know know would love to know know that. Yep. You said in the initial
[17:11] that you had the shorts at eight and the longs at seven delta. That's not the long distance probably. What type of the shorts and the longs when you enter these trades? Yep, so it's any it's
[17:26] width usually. You will get a higher premium from 10 width, but your max loss will be generally a little bit larger. Uh when the VIX is trading between 24 to
[17:38] Uh when the VIX is trading between 24 to 28 maybe 30-ish, we usually look to capitalize off of the 10 delta widths there just because um the separation between the the eight and seven deltas is just going to be a little bit larger.
[17:50] is just going to be a little bit larger. So typically we look to enter the longs uh in a 10 width unless we're trending more towards the 20 spot price on the reduce overall width because the separation from our bands is going to be
[18:04] lower. Uh and we'll have less wiggle room so to speak. Why you run with such tight distance between the shorts and the longs? Generally just because this strategy by nature is already pretty high risk. So
[18:19] if you're entering into a short and then your long is going to be about 20 points your long is going to be about 20 points above say, the the difference between between the short and the long as price is breaching it, your your shorts are
[18:33] going to to really hurt your net P&L before your your offset by those long before your your offset by those long strikes. So it's it's in a sense trade management where generally when you have a 10 width often
[18:46] there, upon a breach your max loss is going to be about seven to eight times going to be about seven to eight times higher than your uh max win. If you were to have say a 20 width, a 30 width, 40 width, 50 width, that max loss
[19:00] And even though with this trade management using the gamma heat maps and whatnot, you can always limit that max loss, the greater distance between your bands, even though you're limiting it, is still going to be just a greater loss
[19:14] in comparison for large moves. Um because we we've had scenarios where there's a super high impact tweet from the president while we're in an option midday. And there there are times where we're absolutely selling for a loss. And
[19:27] there are also times where those 10 widths have really saved us from from enormous losses where I think the last thing anybody in here would want to experience is you're in a condor and all of your conditions look great, your
[19:41] there's a tweet from the president, and then you're down 1,000%. So, it's really just about overall risk management. And that leads me to the exit mechanics that that leads me to the exit mechanics that you use. What are your take profit
[19:56] rules, and do you run any kind of stop loss? Or is the distance max loss your stop loss? Yeah, so definitely not our max loss. Um we we like to always be able to limit that. And our ideal take profit
[20:11] while managing it is just to run these to close. Or or generally we look to to close. Or or generally we look to capitalize on a minimum of of 80 to 85% profit on these options. And the way that we do it is just by managing the
[20:24] overall heat map exposure. So, our stop loss is more or less visualized by moves above or below key levels that we're looking for deceleration within. And it's not actually a fixed spot price, generally just looking at a
[20:39] chart. We're not looking at a break of an SMA or an EMA, we're looking at our heat map exposure to understand deceleration. So, it's more or less direction or another, we will look at the heat maps and say there's going to
[20:53] buying here, we need to closely watch this, and then the longer that we can stick in these deceleration areas, the more theta is going to provide us that that vol crush premium. So, it's it's really about
[21:09] managing. Like the biggest thing that I can can drill into everybody's heads is understand these heat maps and understand the effect of them because above 80% profit. And there are a lot of times in these
[21:24] options where if you're experiencing chop, you can be at 80% by 1:00 p.m. And favorite where then you can just take the rest of the the trading day off having having made a great trade, but a lot of
[21:37] the stop loss and take profit is visualized by understanding the market maker positions and being able to to capitalize off of front running expected behavior. Does this mean you do not have any automatic stop loss if I understand
[21:53] you correctly? You are have a mental stop loss depending on your total stop loss depending on your total exposures according to this exposures according to this gamma maps. Yep. In 90% of cases that
[22:05] that is 100% true and the 10% lies within tweets, large macro moves. Like there there are some tweets that have such a high impact where it's almost an automatic sell. But in the in 90% of our cases, this is managed by the
[22:20] gamma maps. I'm still a bit unclear to me exactly when will you close the trade for loss? So, if I am in a condor here and we're looking at this exposure. Let's visualize my upper band is around
[22:34] 70 55 here. If we break through this entire cluster and it's also going to be depend on the time that this happens. So, if we break through this cluster at 11:00 a.m. I'm going to have to sell no matter what it
[22:50] is just because the the theta is not going to offset the size of this move. If this happens around 2:00 to 3:00 p.m., the value of your option is going to be significantly different than 11:00 a.m. So, if my upper band is 7055 like
[23:05] cluster, I am going to be down at a minimum 100%. 2:00 to 3:00 p.m., I'm going to be anywhere from probably down 10% to up
[23:17] maybe 25%. So, I'm going to look for just significant moves where if we break through this cluster, and I have a upper strike of 7055 for my short option,
[23:29] I'm going to have to sell. I'm visualizing this as we're expecting massive deceleration and with a cluster this significant, likely a reversal or stop out. So, if we break through this, I'm going to understand that there is
[23:43] massive momentum within this intraday and I'm going to have to exit. Other there are slightly different opinions on where you're going to take a take profit. For me, if we're if there is a macro
[23:58] going to look to sell roughly around 85% almost always. Just roughly around 85% almost always. Just because your exposure to the market when there could be tweets coming out at any time, I want to be able to be in a trade
[24:14] like this for as little amount of time as possible so that I cannot so that I can avoid exposure to just unforeseen events. But, in terms of managing stop it's going to be breaking through key levels. I'm going to look for a lot of
[24:26] this positive gamma range, and if they get broken, breached, or there's just too much momentum, that's when I'm visualizing a stop through a break of a key level. That's when you close the trade. What about during the day if the
[24:42] market goes against you? Will you manage these trades somehow by Will you manage these trades somehow by rolling or adjusting in other ways? Typically, a hedge will be inputs via debit spreads if we're seeing some
[24:56] type of movement that looks irregular. So, if I were to be in a trade, like I said, we open right at market open so that we can catch uh the volatility premium. And then, like I said, within the first 30
[25:08] to 45 minutes, uh granted there's no macro move driving you can expect the value of your option to be up anywhere from 10 to 20%. When you're already up in that 10 to 20% range, it's it's really crucial that in
[25:22] the first half of the day you're watching the intersection between SPX you're starting to break through key levels in one way or another, that's when you can input the debit spreads early because your condors already are
[25:37] up 10 to 20% like I said. So, you're getting a discount on the debit spreads to understand the impact of moves and the interaction between those and your market maker positions to be able to input a debit
[25:51] spread. And typically with my debit spreads, if I'm in the 10-width condor, I will take the strikes directly above both of my short and long positions. So, so you will enter a debit spread just uh beyond your iron condor to
[26:07] as a hedge if it goes keeps going in that direction. Yep. And you're catching that as a discount from the uh from the early morning vol crush or vol spike, Right. So, you will try to keep the cost within what what it has profited? Yep.
[26:24] And how long would you keep this debit spread spread on? If the market is moving if if that rate continues, um if we're seeing that within the first couple of hours, say I open the debit spread at 10:45 a.m. If I
[26:40] around noon the irregular moves continue, I'm likely just going to keep everything on because catching those debit spreads uh and since it's only single one single direction,
[26:53] uh, I'm likely going to take those to expiry because the max loss from my condor is going to be offset by the max win from those debit spreads. If we're seeing that, uh, just total volume and general moves are
[27:08] normalizing, then I'm going to look to offload the debit spreads probably within that that roughly 12:00 p.m. window because after 12:00 p.m. Eastern time, sorry. Um, theta really starts to capitalize at at at an increased rate.
[27:23] So, if I'm understanding that the interaction with our heat maps is normalized, it's doing what I would say is normal, what is expected, um, when positions, price is stalling, the deceleration and acceleration is
[27:38] functioning as properly, I'm going to look to offload those around noon, I would say. Do you have other ways you manage these trades? Instead of debit spreads, you could look to implement butterflies. So, if we are
[27:52] generally in, uh, like that image that I showed earlier. So, if we're trending in this general area and we are accelerating at a bit of a faster rate
[28:05] than would be anticipated based on the total gamma exposure here, what I could do instead of a debit spread for my upper bands is I could look to implement a butterfly pinning this positive gamma cluster here because, um, around noon,
[28:19] 1:00, 2:00 later in the day, the butterflies are going to grow at a rate much quicker than your debit spreads if we're floating in this area. And then this is just generally going to be a scenario where once your butterflies,
[28:34] will be enclosed within this area, then you can just close all positions because if this is a later day move and we're still maintaining these 70/55 strikes up top, our butterflies within this range around 2:00 p.m. If we open well below,
[28:51] around 2:00 p.m. If we open well below, we'll be up 100 plus percent. That hedge alone will be able to offset any of the lost profits from a move in an upward direction here. So, it can be done via uh butterflies or debit spreads are the
[29:05] preferred. And if market moves are highly irregular, there are times where you can just enter single leg options one way or another. But, that's only highly irregular moves and uh at a very exponential rate.
[29:17] exponential rate. >> What makes you decide between a debit spread and a butterfly if the uh market goes against you? I would generally say time of day. So, if the market's starting to go against me,
[29:30] probably later than noon, noon 12:30, I'd look to capitalize off noon 12:30, I'd look to capitalize off of a butterfly because as price is in day, the nature of a butterfly is going
[29:43] earlier in the day, I would say before 12:31, capitalize off the debit spread. And then the single leg options are just based on momentum, direction, and then irregularities. And let's just very
[29:59] quickly uh repeat what a debit spread is and what a butterfly is. A debit spread is the inverse of your condor. Or since we have a condor, I am selling an option above spot price, and then I'm buying the one directly above it. A debit
[30:14] spread is I am buying an option above spike price strike price, and I am selling the option above it. So, in a credit spread or what we're implementing with the condors, because I am selling the option below
[30:29] the the one I'm buying, when you are above that threshold or you're above the strikes, your option is going to lose value at a quicker rate than it is gaining value because the strike price is activating on your sold
[30:42] options first, whereas a debit spread, since the strike price is activating on your bought options or your long options before your shorts. With a debit spread, as you are above the strike on the long
[30:56] side, you are going to have accelerated gains. With a credit spread, you are going to have accelerated losses, and a butterfly is a pin. So, if I'm trying to butterfly any range, I'm going to sell
[31:10] at the strike price that I'm trying to pin, and then I'm going to buy and sell below. If it's If I'm looking for a move upwards, I'm going to sell two calls,
[31:22] and then I'm going to buy calls around the perimeter. So, if I'm trying to pin 7030 here, I will sell two calls at 7030, and then depending on the width, I could do a five width or a 10 width. With a 10
[31:37] width, if I'm selling two of the 7030 calls, I'm going to buy one option at 10 10 like a spot price 10 above, so I'd buy a 7040, and then I would buy one 10 below, which is a 7020. So, because I'm
[31:54] selling two of the 7030s, buying a 7040, and buying a 7020, I'm going to see a max profit at 7030, and I'm still going to be within profit anywhere between this 20-point range from 7040 to 7020.
[32:09] precision. You are trying to identify a spot price where price is going to settle, and then you are creating a range or margin of error to which it could move in and out.
[32:23] So, a butterfly needs to be precise, you're pinning the exact price, and a debit spread is you are pinning a range. So, you're saying it will be above this range, butterflies are saying it will be exactly right here. And this butterfly,
[32:37] when would you close that one? When you when the market hit hits that pin? Yep. When you hit the pin. And the reason I say I like them later day is because the total RR on a butterfly is massive. If you
[32:51] look to open a butterfly that's pretty out of the money, you can get them for $5, $10 in premiums, and then your total premiums, and then your total anticipated payout can be up to $450.
[33:04] So, you can see thousands of percent gains off of butterflies, and those thousands of percent gains are realized at close. So, the closer that your butterfly is to close, the more it is going to be gaining in value. So, if
[33:18] we are at that pin, say at 3:15 p.m., it's going to be incredibly valuable. If we're there at 2:30, it'll gain value. If we're there at 1:30, it'll be all right. So, the later and later on in the day that
[33:31] you're holding a butterfly at your exact pin, the more it is going to retain some value. Let's talk a little bit about risks. What is the worst that can happen
[33:43] The worst theoretically that can happen is your max loss, which is typically a is your max loss, which is typically a 1:7 or 1:8. The worst that can happen if you were actively managing it is generally 1:4 or 1:5. I believe that's
[33:58] our local max loss that we've incurred. I like to ask my guest to put their strategy on a risk profile scale from one being very low risk to 10 being very high risk. Where would you put your strategy?
[34:13] I would say it's probably an eight. To be completely transparent. That's pretty high. That is pretty high. Um which Um which >> It's high risk because of your max loss.
[34:27] more to lose than you have to gain. And another element of risk is how much It really takes a lot of active management. It's not one of those
[34:39] open it and then walk away, check back up on it, maybe check for alerts on your phone. It's one where you really want to be fully present because irregular be fully present because irregular activity on maybe a 10-second span can
[34:52] really change the entire outcome of the day. Whereas that's that's irregular, but you really needs to be able to manage it the entire day because of how large the max loss is compared to other simple strategies. And
[35:06] the beauty of it though is the win rate is is above 90%. So, although you're actively managing it, it's it's 90% likely that it if you just opened it and closed it and walked away, it would close in profit.
[35:20] But then again, we want to optimize, we want to lower the max loss, and we want to improve the win rate. So, it's high risk because of how much you have to to really manage it. >> Why do you call it the Trojan horse iron
[35:34] condor? To tell you the truth, I came up with it pretty shortly before our meeting. I wanted to I wanted something that everybody could remember. It's the Trojan horse because it's
[35:46] pretty unexpected from the fact that it's it's generally pretty simple. Iron condors are not the most complex option strategies, and I think it's the Trojan horse because it's unexpected, but it packs a punch for sure. Tell us what
[36:00] have been your results of trading this strategy? How long have you been trading it and what results have you seen? I've been trading it for about a year, but I really honed in on the strategy in Q1 and this returned 40% in Q1. Meaning
[36:17] that you grew the account you're trading on this on with 40% or is it another No, that's exactly it. That's pretty amazing. Yep, It It's It's very high amazing. Yep, It It's It's very high grossing. How much of your account
[36:32] are you are you allocating actually risking each day? risking each day? Generally, the max loss is going to look Generally, the max loss is going to look like anywhere from
[36:45] 8 to 14% on on any given day, which which does sound incredibly large. Um but the local max loss that I said is going to be much less and the uh the active management and being able to identify losses is
[37:02] really the the main factor in in separating your wins and losses here. How much premium would you typically collect in terms of selling one contract of your iron condor? And And how much would the biggest losses be compared to
[37:16] this? Generally, if you are opening the eight deltas within that that VIX range that I specified, you can anticipate to collect about $100 to $150
[37:29] in premiums while opening them early day depending how massive the uh vol spike is at open. And if you're collecting, just say you're trading one contract and you're collecting $100 there. The low The max
[37:41] collecting $100 there. The low The max loss on paper is about 750. The local max loss that I have incurred comparatively is 450. And this is a one trade per day strategy. Yep. How would you sum up this strategy in a few words?
[37:56] And what would be your two or three most important takeaways that you really want the audience to remember from this interview? To summarize it, it's capitalizing off of volatility by understanding
[38:11] applicable ranges for price and market maker positions. And what I really want everybody to understand is is two main elements. And the first is backtesting is your best friend in any scenario. If
[38:25] your doctor came to you and asked if you wanted to take a drug to to improve your overall physical health and they told you that the drug is untested, what would you likely say? I would not take it. As as a drug is untested, I would
[38:40] not take that from my doctor. So, if another trader comes up to you and says, "Hey, try out this strategy." and it's untested, why would you risk your financial health when you wouldn't risk your physical health? So, please
[38:52] backtest everything and do it mechanically, anti-discretionary. That's bare-bones backtest because even the most basic form of this strategy was profitable over the past year.
[39:05] Don't go off of faith. Don't go off discretion. Everything needs to be rigorously backtested and optimized. And the second is understand market maker activity by looking at gamma charts. It's it's incredibly incredibly
[39:19] lucrative and there's so much information to even bolster your overall understanding past what I've explained. So many mathematical equations that can So many mathematical equations that can tell you the exact notations of of every
[39:32] concept that I've explained. There's so much to learn there and it goes well beyond just this strategy alone. What would be good resources to learn more? VolSignals, like I said, that's a great platform. Those people do a great job. I
[39:46] would also say there's plenty of books that will explain it. Ev- even if you want to take the lazy route, you can just prompt any AI to be able to lead you directly to these formulas or lead you to to further resources. Uh is there
[40:00] you're mentioning that you would recommend? One of the books that I read, Trading Volatility, is great. That that's probably where I would start. Otherwise, if you're into quant books, I like a lot of the research papers posted
[40:13] by Harvard University on those. So, those are a few different sources that I would look towards. And I would uh recommend the viewers, if you are curious about trading with GEX levels, we do have an interview with Doc McGraw
[40:27] who walks us through the gamma level, what it means, how you can use it for a trading in even more detail what than we have done today. We do also have a an affiliate partnership with Mentor Q, which is one
[40:41] of the other software tools that is also offering gamma exposure levels as part of their analysis package. Thank you very much, Brent, for sharing how you trade the zero DTE with the brand new name Trojan Horse Iron Condor.
[40:58] Well, thank you, John. It's been a pleasure.


⚡ Saved you 0h 41m reading this? Transcribe any YouTube video for free — no signup needed.