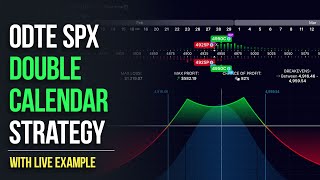

Live 0DTE Double Calendar: Up $321
44sShows a live profitable trade with real-time P&L, creating curiosity and engagement.
▶ Play Clip"Title accurately describes the content: a live walkthrough of an SPX 0dte double calendar trade."
This video provides a detailed walkthrough of a live zero DTE (Days to Expiration) double calendar options trade on the SPX. The trader explains the strategy, risk management, and the reasoning behind entering the trade, including analysis of gamma exposure, implied volatility, and price action. The goal is to profit from time decay and a choppy, non-directional market.
The trader is in a live double calendar position using zero DTE expiration on SPX, currently up $321 on three lots. The position was opened around 11:30 AM.
A calendar spread involves selling a short-term option and buying a longer-term option at the same strike. It benefits from time decay on the short option, creating a profitability 'tent' if price stays within a range.
The trader chose a zero DTE calendar because they expected little price movement, based on choppy price action and gamma exposure levels. The zero DTE option decays quickly, making it suitable for range-bound markets.
The trader used gamma exposure levels, specifically the absolute gamma strike for Friday's expiration, to identify key support/resistance zones. The flat gamma profile indicated no strong directional bias, supporting a non-directional trade.
The double calendar had strikes at 4950 (call) and 4925 (put). Max profit at close is around 20% if price stays between strikes. The trader targets 8-12% profit and recommends taking profit early due to IV sensitivity.
IV fluctuations cause P&L swings. The trader notes that even with a small price move, IV changes can reduce profits. They advise taking profit when up 6-10% within an hour, as IV can quickly erode gains.
Price was near the gamma flip level (zero GEX), where gamma changes from positive to negative. This zone often leads to choppy price action, supporting the decision to run a non-directional strategy.
The trader chose a double calendar over an iron condor to be long vega (benefiting from rising IV) for tomorrow's expiration. This provides exposure to potential IV increases while still benefiting from time decay on the zero DTE.
Despite the VIX dropping nearly 4% on the day, the zero DTE calendar remained profitable due to time decay. This highlights the advantage of zero DTE calendars: time decay can offset IV decreases.
The trade stayed green all day, which psychologically made it easier to hold. The trader notes that if a trade turns red, they are more likely to take profit on the next green. They recommend aiming for 2-3% profits for consistency.
Zero DTE double calendars can be effective in range-bound markets, capitalizing on time decay while managing IV risk. The trader emphasizes taking profits early (5-8%) and using gamma exposure levels to identify low-volatility environments.
What is a calendar spread in options trading?
A calendar spread involves selling a short-term option and buying a longer-term option at the same strike, profiting from time decay on the short option.
01:07
What is the 'tent' in a calendar spread?
The 'tent' is the profitability zone of a calendar spread, where the P&L is positive if the underlying price stays within a certain range.
01:50
Why did the trader choose a zero DTE double calendar over an iron condor?
The trader wanted to be long vega (benefiting from rising IV) for tomorrow's expiration, which a double calendar provides, while an iron condor is short vega.
14:11
What is the gamma flip level?
The gamma flip level is where gamma changes from positive to negative, often leading to choppy price action.
13:07
What profit target does the trader recommend for zero DTE calendars?
The trader recommends taking profit at 5-8% for consistency, or 2-3% for a more conservative approach.
25:19
How does implied volatility affect a calendar spread?
Changes in IV can expand or contract the profitability zone and cause P&L fluctuations, making calendars sensitive to IV changes.
02:15
What is the benefit of zero DTE calendars even when IV decreases?
Time decay on the zero DTE option can offset IV decreases, allowing the trade to remain profitable.
21:35
When does the trader prefer to close zero DTE positions?
15-30 minutes before market close to avoid after-hours risk, as SPX options trade 15 minutes after the bell.
07:15
What additional confluence did the trader use besides gamma exposure?
The trader used the 15-minute opening range and weakness in QQQ (below VWAP) to confirm a bearish bias.
22:17
What is the 't+0 line' in a calendar spread?
The t+0 line represents the theoretical P&L at the current time, which changes as time passes and IV changes.
02:03
Calendar Spread Mechanics
Clear explanation of how a calendar spread profits from time decay, forming a profitability 'tent'.
01:07Gamma Exposure as a Tool
Demonstrates using gamma exposure levels to identify key support/resistance and low-volatility environments.
03:48Profit Taking Discipline
Advises taking profit early (5-8%) due to IV sensitivity, a key risk management insight.
08:46Zero DTE Advantage Over IV
Highlights that time decay can outweigh IV decreases, making zero DTE calendars robust in falling IV environments.
21:35Consistency vs. Max Profit
Recommends aiming for 2-3% profits for consistent income rather than holding for max profit.
25:19[00:01] Tuesday February 6 2024 and the market is currently open it's Power Hour the market closes in a little under 50 minutes and this is a live position which I'm currently in it is a double calendar using a zero DTE expiration
[00:15] this is my live risk profile right now on thinker swim I'm in three lots of the double calendar the position is currently up 321 bucks and let's just just so you guys can see that it matches up here so let me just increase this I
[00:29] one lot because it makes it easy to scale up or scale down for the next time as I'm journaling I take notes of what the Greeks are when I open the position if I'm running six Lots it makes it easy to just standardize the positions over
[00:43] let's just increase this to three so you guys can see this is how much margin is being used on the trade this is the max profit for the day and throughout the duration or the lifespan of the trade I take notes I open it around 11:30 here
[00:55] today and I take notes so about 45 minutes after I open the trade a little opened a trade and then just at the start of Power Hour which is when I video because I figured this might be some information that's pretty valuable
[01:07] to you guys a calendar inherently is going to benefit from an increase in expiration if you don't know what a calendar is it is a combination of selling or shorting one contract and then buying that same expiration at a
[01:22] further out in time obviously when I say one I'm just you can scale up or scale down but for the basics or learning this is just saying we are short at 4950 call for this date so February 16th and then we're simultaneously buying the 4950
[01:35] call for further out and time date the reason we open this is because time Decay is going to be eating away at the option that expires closer to expiration so obviously February 16th is closer in time to right now than February 26th so
[01:50] option faster than it's eating away at this option and that's going to create a curve right here or a tent that it's commonly called and this is your profitability zone so as long as price is within this tent you're going to be
[02:03] profiting and this is the p&l at expiration this is the lifespan of the trade this is what's referred to as the t+ zero line so as time passes by that's what your theoretical p&l will be however imply volatility affects the
[02:15] trade if if implied volatility contracts then so will your profitability Zone on top of that if the implied volatility increases for your front month so the option that you are short in this case this is our front month right here in
[02:28] this hypothetical example if imply volatility increases for that month you guys can see so can your profitability zone or your t plus Z line so that makes calendar is very sensitive to changes in implied volatility however when you're
[02:41] running a zero DTE calendar you are capitalizing off of the fact that the zero DTE option is going to be getting chewed up by time Decay and that's reason number one as to why would I even consider to run a trade like this it's
[02:55] because I was not expecting much movement in price this is the spy for the to day as you guys can see it's been pretty choppy and I'll walk you guys little bit earlier in the day but let's just jump to take a look at the es for a
[03:08] in which I've had on my charts just taking a look at the volume profile I've had on my charts ever since it started forming a couple weeks back and forth and watching its price action has traded around it on top of that we have
[03:22] some point of controls that are slightly under and every time the SPX or the es has reached any of these demand zones we've seen some sort of a bounce or we've seen some sort of choppy consolidation in price action around
[03:35] these significant levels so at the start of the day I wasn't really expecting much movement for the markets however I waited at least an hour before even deciding to take a trade because I wanted some additional confluences the
[03:48] additional confluences in this case came with the gamma exposure so this purple right here this is the absolute gamma strike for Friday's expiration and if I at the start of the week if you guys are new to this YouTube channel I'll leave a
[04:03] exposure playlist in which I've cover gamma exposure many times and I've also shared what I like to do or how I start my week by plotting out my levels on my charts taken from the gamma exposure profile so it's taking a lot of the
[04:17] discretionary or a lot of the bias out of where these levels are coming from I think is support and resistance I'm just plotting levels that are coming chart and it's letting me know that these are going to be key infliction
[04:31] prices or they're going to be areas of high liquidity by key infliction it these zones and we find additional confluences we are likely to see some sort of a reversal if price is around these major strike prices we're likely
[04:43] to see some sort of choppy price action I've done many videos on this in the previous ones in which I go into further detail so my thought process being hey here you just look at a clear chart I already knew this is the absolute gamma
[04:56] strike for Friday expiration on the Spy so that's for 493 and then on top of that at the start of the week when I draw out these levels this was also the last strong positive gamma exposure strike if we jump over to the Quant
[05:09] trading app Discord this was earlier in the day here today so this is just a feed of the gamma exposure changes on the zdt SPX options throughout the day so a little around 11:15 as I was taking a look at this this was the current spot
[05:21] a look at this and I was noticing that there wasn't really that much profile compared to previous days if you've been trading with gamma exposure to just take a look at it and see when one side is being more aggressive than
[05:35] the other let's just say I was seeing some really huge green bars all the way up here and then another one really far up here and price action was in coinciding with this and we were seeing some really aggressive buying you know
[05:47] the Spy was staying above vwap all day then I'm definitely not going to run a non-directional trade like a double calendar I'll probably just go with an something like that but because this profile looked pretty flat or even on
[05:59] both sides this is pretty flat up here this is relatively flat up here spot price is right in between the two I don't really have much of a directional going to head to here or it's going to head to here I have no idea which way
[06:11] it's going to head and because of that I'm going to consider mocking up other words if price was to go up here or if price was to go back down here it really doesn't matter to me as long as it doesn't go too far so as we take a
[06:23] look at the live pnl right here you guys can see the call side was $ 4950 and then the put side as we can see right here is 492 so that's right down here so this is where there's Max profits at the close of today if price remains in
[06:37] between this is where the profit is going to vary or bounce around as you just going to slide this this is if the market was to actually move a little bit you can get a theoretical representation of your p&l but let me actually just uh
[06:49] reset this to make sure it is at the right strike price and then let me just remove the slices so we're just paying attention to the live price right now of the SPX this is our live price this is where the SPX is again this position
[07:02] where the SPX is again this position expires now in about 38 minutes or so so let it expire obviously I'm not going to do that I like to close these positions out around 15 to 30 minutes before the market closes just because anything can
[07:15] happen after hours and SPX options are actually trading 15 minutes after the Bell closes don't like to take that type of risk so I will be closing this out probably as soon after I'm done wrapping up this video now something I want to
[07:27] point out is when I open the trade uh T right here is just what thinker swim was front month I like to take not I like to take note of that and as you guys can see that's the Thinker swim implied volatility for the front month so my
[07:39] front month is the zero DTE so February 6th was around 18.15% that's at the time in which I opened the trade then about 45 minutes or so imply volatility increased for the zero DTE and that is often what happens the back month also
[07:53] increased a little bit my profit actually ended up jumping pretty high and this is usually where I would just take profit on a position like this because as you guys can see I've been holding the trade now all the way until
[08:05] power hour so it's been over 3 hours and the position has fluctuated from 7.6% earli in the day to being up 12% now yes this is more than earlier however it was up 11% a little bit after lunchtime here so sometimes it's not worth it to hold
[08:20] the max profit this position can actually make by the closes around 20 probably going to decrease a little bit because tomorrow is Supply volatility will decrease a little bit if the SPX was to push up a little bit more just
[08:34] another five points or so is what's needed for Max profitability and obviously it needs to close up there but for the most part as you guys can see you're generally going to be targeting or aiming for around 8 to 12% anywhere
[08:46] within that sweet spot if you're capturing about eight almost an 8% well take your profit if you're trading zero DTE calendars because of how sensitive they are to imply volatility just take in other words the quote
[09:00] unquote easy money when you're in something like this this quickly I took note of here this is actually supposed to say a 4939 not 39 obviously the SPX to say a 4939 not 39 obviously the SPX was not at 3939 today but 4939 the
[09:12] position was open at 4940 so the SPX moved about one point in over an hour and you guys can see that the p&l actually decreased it went from being up plus almost 8% to being up only plus about 6% so even though price barely
[09:27] move the imply volatility increased for the back month so when I opened the trade imply volatility for tomorrow was 14.11 now it's only
[10:00] trading at zero DTE and that's because the implied volatility for tomorrow's I could have went with a Thursday expiration even a Friday expiration the imply volatility is likely to also decrease if the market is doing this
[10:15] going absolutely nowhere of course if there's expected event on Horizon let's just say tomorrow is an fomc report then that can change or skew what's going to continue to hold the trade a little bit over another 30 or so and then you guys
[10:30] can see now the Imp then the p&l ended up jumping back up as the as the zero DTE imply volatility started dropping so it was no longer as high as it was early it was no longer as high as it was early it went to
[11:00] to the t plus Z line so you guys see let me just reset that I'm going to increase the imply volatility for today you see what's happening to the profit it is actually shrinking so that's horrible so that makes me uncomfortable doing so I'm
[11:13] just going to reset that back to what it normally is make sure let me just boost actually uh what it is going to just refresh the page just to make sure it is accurate and then let's just uh zoom out here and let's go to uh today's close
[11:29] reset the size put it back to three so that's just something to be aware of if trading the Zer DTE calendars know that IV is going to be fluctuating like mad fluctuations in your p&l and that is likely what's happening then at the top
[11:44] of Power Hour we can see what started happening the p&l started dropping again and that's just because the 1 DTE implied volatility dipped it is now 12% when I first opened the trade it was 14% that is a -2% drop in imply volatility
[11:59] for tomorrow that is also what you don't want to happen because I bought these contracts for tomorrow I don't want the imply volatility to decrease the same tomorrow's expiration and I decrease the imply volatility you guys see what's
[12:13] happening to the profit so that it's also a scenario in which you don't want to occur the reason I'm demonstrating this is because I'm trying to highlight again if you're running zdt iron condors and you hit a 6 to 10% profit Target in
[12:26] under an hour you're better off just taking your profit unless you're doing right now such as holding the position into the close or into the last few bit more profit this is not something I would normally do again in normal
[12:40] circumstances I'll be taking that profit as soon as I see sometimes even 6% entire day so it made it a little bit easier to hold as I wasn't watching it position the moment you see 6% you're just going to take the profit lastly if
[12:55] we head back to the gamma exposure I was hoping to highlight again why I'm thinking the SPX is just going to head up to around here chop and then head is largely coming from the gamma exposure lastly if we also take a look
[13:07] at this we can see that the price right here was hovering around what's referred to as the zero gex level or the gamma flip level it is right where the positive G so all of this is positive gamma all of this is negative gamma and
[13:20] then we can see where the spot price is let me make this larger again spot price is right around here this just in this area so just where the negative gamma positive gamma meets all of the negative
[13:32] gamma generally in this area it's kind of a Zone you're going to have what's called a gamma flip again this is just for the zero DT expirations so the gamma positive to negative and whenever price is around that gamma flip strike I'm
[13:45] also going to be expecting price to be pretty choppy that's what also triggered the thinking in why I wanted to run this strategy I could have ran a zero DTE strategy I could have ran a zero DTE iron Condor or a zero DTE Iron Butterfly
[13:58] calendar this time just because I wanted to be long Vega which is just long volatility in case imply volatility for tomorrow was to increase that would have really benefited the calendar and I
[14:11] didn't want to be short a uh zero DTE contracts today like a Iron Butterfly or an iron Condor I didn't I wanted something that would have some exposure to tomorrow's expiration because on the same end if we were to go to tomorrow's
[14:24] volatility to tomorrow you guys can see what can happen to the PN for today tomorrow's implied volatility spiked this much and today's implied volatility didn't have any kind of Spike it's not a scenario which I'm aware of that would
[14:38] exaggerated sense if imply volatility was to increase across the board this would be great for the uh double calendars and that's a scenario to volatility exposure so this is the Vega right here I want it to be long Vega I
[14:52] want it to be long Theta the Delta didn't really matter it was essentially borderline delta neutral which means I was not pick taking a direction this is a great strategy to have in your toolkit zero DTE calendars I prefer to go with
[15:04] because it gives a little bit of a wider range and then it allows me to instead of getting 10 Lots or six lots of one single calendar it allows me to spread that across multiple contracts just to increase that range a little you do get
[15:19] a slight Valley in between that you can suffer some sort of a risk if in if and the market went absolutely nowhere by the close but you can counter that by calendar as you guys can see the separation here is only 25 points
[15:35] between my put and my co side so 25 points is a pretty high Delta uh contracts because I open this when the SPX was at 4940 so in a sense I only SPX was at 4940 so in a sense I only went plus 10 points to 4950 and I only
[15:49] went down 15 points to create the put side here so 4925 and then 10 points to the upside to give us this uh 4950 so I didn't really go that far out the money the money on the call side and a point or three on the out of the money on the
[16:05] put side and that gave me a nice wide structure in which I was comfortable structure in which I was comfortable with also being aware with the uh gamma profile was I was conscious of the fact that the market could go down to 4920 so
[16:17] room to the downside I was just a little bit more concerned that the SPX might take a look at Price action at the time in which I was opening the trade we were a little bit below you know we had already breached the 2-day anchored vwap
[16:31] we had already broken which was the last strong positive gamma strike however I keep selling this is the Spy I use for analysis but if we just head over to the SPX this is the range or the Zone on the
[16:44] SPX in terms of by expiration today when the double calendar would not be profitable so this is in a sense what the profile looks like if price remained between here and here the trade would be profitable so as I open it around here I
[16:58] downside and a little bit less room to the upside but this is in a sense what I was expecting to be my safety area and I would have expected price to stall out from looking at the gamma exposure profile and then also being conscious of
[17:14] our opening range so right here this 15-minute candle this is our opening everyday Trader should be aware of that's first 15-minute candle some the first 15-minute I think is appropriate and works just as well in my
[17:29] attracting the 30-minute opening range in over 4 years or so these days I just pay attention to the 15minute opening range so the expectation would be price was below the 15-minute opening range so I was not expecting it to come back up
[17:43] this 15-minute opening range we already saw some weakness to start the week here so my expectation or my concern was a little bit more to the downside than the upside if price was above the 50-minute
[17:56] sort of a different bias or maybe I would have tilted the double diagonal in definitely going to look to lock in his profits here I'm going to just Journal this if you guys uh are curious all I'm going to do is just copy this here I'm
[18:11] going to just size this back down to one so I can save it in terms of this right here I'm going to go to Just Save scroll down and then um just going to add to my down and then um just going to add to my notes the time so it is now 3:36 p.m.
[18:26] eastern time going to just add the p&l at the time make sure I log the IV it's now 11.3 I'm going to just double check that let me just save this double check because I have been playing around with the IV just make sure that's correct
[18:40] okay so it's 17.4 I should just double check this here I'm just going to make check this here I'm just going to make sure this is uh right so
[18:53] my notes I'm sharing it you guys use whatever system method works for you guys and and since it's live I figured I might as well show you guys I've never I'm just checking my other monitor for dinker swim checking what the implied
[19:06] volatility is it's saying for the zero DTE it's now DTE it's now 16.46% and then tomorrow it is 12.37% so it looks like it went up a little bit from about 36 minutes ago
[19:18] which is great I'm just going to Mark these spots so that's 4943 that's where the SPX is currently trading save that there and now I know take a screenshot journalist going to be closing out pretty shortly and then I
[19:33] will s save this in a folder so the next time I want to run a zero DTE double calendar how did it perform the next time I'll also take a screenshot of what can reference it and then lastly I'll take a uh I'll save in my journal what
[19:46] the gamma exposure looked like because this is the profile that I might use or time then I'll know this is the strategy I would like to run in terms of risk management if the SPX broke above the high of day then I would have decided if
[20:00] I wanted to close out the put side maybe I would have ran a zero DTE long call butterfly so something in this area here I would have taken a look at what other spiking in the gamma profile up here I might have used a butterfly to just
[20:14] other things I would have taken a look at to be aware of but for the most part there was no real need to manage this or I'll just set a stop loss at uh 6% Orga 8% and try treat it as a almost one:1 risk reward ratio because the
[20:29] probability of success is pretty high so if I'm looking to make maybe uh 7 or 8% I might give be willing to let it draw down 10% and then the expectation more times than you would be losing on a trade like this if you have a smaller
[20:43] profit Target so something like 5% or maybe even 3% you'll more than likely be market just closed and I realized there something else I forgot to point out in this video here if we take a look at the vix on the left hand side which you guys
[20:57] vix on the left hand side which you guys know is is a proxy for imply volatility as it is based on the SPX options you guys can take a note of what happened with the vix here today this is a day in which imply volatility actually
[21:09] decreased I open the position again somewhere around here so around 11:30 or so and from the moment in which I open that position imply volatility did increase a little bit but then ultimately by the close I recorded this
[21:22] video a little bit around here the vix was already down over 2% and then all the way into the close the vix was down almost 4% so even on a day where implied volatility decreased and I was long Vega it did not matter for the double
[21:35] calendar because the zero DTE time Decay and that's the benefit in my opinion to running the zero DTE calendars I've been running calendars for a few years and I've experimented all different types of expirations they are very unpredictable
[21:49] at times because of impli volatility but it is very reassuring to know that even on days where the implied volatility or the vix decreased Ines you can still the vix decreased Ines you can still benefit because the zero DTE time Decay
[22:03] and largely another reason why I was not so worried about the upside at least earlier in the day is because you guys know I look at the QQQ in tandem with the Spy so the q's earlier in the day it's hard for the SPX or the Spy to
[22:17] continue increasing or to go up when the q's are showing weakness the qes were below the two to Anchored vwap it was also below vwap and that right here within the same time frame is around this region here a beer flag if your
[22:30] technician was forming on the cu's a beer Penance beer flag however you look at it this is reading as weakness from a technical standpoint we are below key structural levels we are below a dynamic resistance level in this case it is the
[22:44] vwap it is the two-day anchored vwap and this does not look like strong price action so knowing that the cues were weak and understanding the gamma look at the Spy context around the absolutes gamma
[23:00] strike and then also taking a look at the price action and what happens around these convergence is what gave me the conviction to hold a trade like this for guys can see there's a little bit of a spike but the SPX ended up closing right
[23:16] around let's see right here 4954 and this is what the trade look like at the close right about around where the uh Break Even was so if held until the actual close the SPX options are still updating after the market all
[23:32] the last 15 minutes of the day and that's why it's not worth it to hold in better off realizing those gains and then maybe trying your luck with some sort of out the money very cheap butterfly or maybe just going with an
[23:45] out the- money option that's going for maybe 10 20 cents at that point you're practically gambling and you're hoping for some sort of a unexpected move in does happen quite often so it's not a
[23:57] complete you know throwaway of your cash and then lastly if you are curious about Downs mostly for these types of Trades because it is important to know for was open right around here there was no
[24:10] initial red for about a minute or two but then this is the p&l throughout the day there was a little bit of a dip here as the markets made a push around 2 p.m. eastern time up but then you guys can see it did not return to the price in
[24:23] which we opened it for so the p&l continued to remain above the price in which it opened and that's also what made it easier to hold on days in which you are holding a position green and then it goes red psychologically you're
[24:35] more likely to just take profit the next time it goes green if this is where you open this is the trade green this is the trade turning red once it turns green on included I'm more likely to just take the profit however if the trade never
[24:50] really was red and it remained higher than the price that I opened it then I'm play itself out so that's something that's important to take note of I around the 2 p.m. so this is right when the SPX made a little bit of a push here
[25:04] volatility also dropped in that push and then if it was to keep going up if it did this move right here earlier in the day then the profit would have been much less than the 8 to 10% it probably would have been closer to maybe 4 or 5% so you
[25:19] your profits but at the end of the day you're risking some profits to potentially make more in my opinion again just take the profit if you're again just take the profit if you're around 5 to 8% on these zero DTE type of
[25:31] calendar spreads if you're looking for consistency and really building out a strong income type of strategy that you can run zero DTE I would say aim for two to 3% profits something that's also important to take note of is I didn't
[25:45] bother to trade the volatile opening session I waited well over an hour after the market was open and I let price settle in I took a look at a multiple to also take note of there's no need to rush into a trade the same thing like
[25:57] once we came down to this area of convergence here and we had a bounce opening session if it gives you anxiety wait an hour sometimes you don't even need to open up think or swim or open up your trading platform until 10: a.m.
[26:11] opens when there's more information there's more data prices settled into certain spots a little bit more I know that works better for me especially at bit more difficult than not it's often probably because you're trading during a
[26:24] time frame that does not really work for you or time span it doesn't really match jump back to the conclusion that I this session I'm going to wrap this video up here hopefully you enjoyed it
[26:37] hopefully you learned something and hopefully this is another strategy that you can add to your toolkit for ZTE non-directional trades thanks for watching guys and I'll catch you in the next one
⚡ Saved you 0h 26m reading this? Transcribe any YouTube video for free — no signup needed.