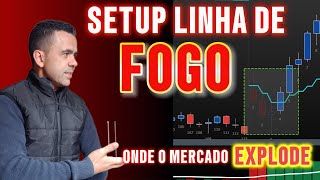

The Firing Line: How to Trade the First 15 Minutes
42sThe concept of a 'firing line' is a catchy metaphor that promises a clear edge in the market, appealing to traders seeking a simple yet effective strategy.
▶ Play Clip"Delivers a solid, actionable strategy, but the title oversells 'most profitable' without proof; content is useful but padded with channel plugs."
The video presents a day trading strategy for the Brazilian mini-index (mini índice), focusing on the 'firing line' (linha de fogo) — the initial battle range formed in the first three 5-minute candles. The presenter, Edmar Castro, explains how to identify this range, use volume and VAP indicators for confirmation, and execute trades with a defined stop loss and a 1.5x risk-reward target.
The market creates a 'firing line' — a point of contention between buyers and sellers at the start of trading. The strategy waits for this fight to resolve before entering.
Add the 'financial volume' indicator to the 5-minute chart. Right-click, insert bookmark, select financial volume, and set coloring to low/high colors.
Add a 20-period moving average to the volume bars, colored white and thickened for visibility. This average helps confirm volume strength.
Add the VAP (Volume at Price) indicator to the chart. It helps identify price levels with high trading volume, used for stop placement and confirmation.
Add a candle counter indicator to number candles, making it easier to identify the first three candles of the session.
The first three candles (9:00–9:15) define the battle range. The market settles 70-80% of the time in this period. Mark the high and low of these candles to create the range.
Wait for a clear breakout of the range. Confirmation includes: breakout candle closing above/below VAP, and volume above the 20-period average.
Place stop loss at the VAP or at the low/high of the breakout candle (if below/above VAP). Use Fibonacci projection tool from stop to entry, projecting target at 1.5x risk.
Create a color rule to highlight the first three candles (candle counter < 4) in black for easy identification. Name the rule 'firing line'.
Each day: let first three candles pass, mark range, wait for breakout. For sells, confirm with negative volume above average and candle below VAP. Place stop at high of breakout candle, project target downwards.
The strategy typically takes one trade per day, capitalizing on the first decisive movement. It usually works well when the market defines direction early.
The 'firing line' strategy offers a systematic approach to day trading the mini-index by trading the initial range breakout with volume and VAP confirmation, aiming for a 1.5x risk-reward. It emphasizes discipline, waiting for clear signals, and taking only one trade per day.
What is the 'firing line' in the context of this strategy?
The initial battle range formed in the first three 5-minute candles (9:00–9:15) where buyers and sellers contend.
00:02
What indicators are used in this strategy?
Financial volume with a 20-period moving average, VAP (Volume at Price), and a candle counter.
01:20
How is the entry range defined?
By marking the high and low of the first three candles of the session.
03:12
What confirms a valid breakout?
The breakout candle closing above/below VAP and volume above the 20-period average.
04:25
Where is the stop loss placed?
At the VAP level, or at the low/high of the breakout candle if it is above/below VAP.
05:10
What is the target risk-reward ratio?
1.5 times the risk, projected using Fibonacci from the stop to the entry point.
05:39
How often does the market settle in the first few minutes?
70-80% of the time, between 9:00 and 9:15-9:20.
03:25
What is the recommended number of trades per day?
One trade per day, taking the first decisive movement.
08:52
Firing Line Concept
Introduces a clear, actionable concept for trading the opening range.
00:02Market Settles Early
Provides a statistical basis (70-80%) for the strategy's timing.
03:25Breakout Confirmation Criteria
Defines specific, objective conditions for entry, reducing ambiguity.
04:25Risk Management with VAP
Shows a concrete method for stop placement and target projection.
05:10One Trade Per Day Discipline
Emphasizes a disciplined approach to avoid overtrading.
08:52[00:02] the market creates a region that I like to call the firing line. It's a point of contention between buyers and sellers right at the start of trading. It's important for this fight is resolved, we can step in and take
[00:15] advantage of the movement. That's precisely what I want to show you in today's video : a strategy to capitalize on this trend. Hey there, interesting topic, right? I'm Edmar Castro, welcome to our channel. And if you
[00:28] channel right now. Turn on notifications to receive alerts for every new video leave a like if you really enjoyed it. And I also ask that you follow us on Instagram, our Instagram account, where I post daily
[00:41] recordings of our trading operations, results, and lots of tips about day trading. Speaking of our operational system, the link to our website is in the description of this video Corus, which is our operational system. And if you have any questions,
[00:54] 'll be happy to answer them, or send them to our email address, which share my chart, my screen, with you and explain in detail how you can set up your own chart to take advantage of this
[01:07] market movement. So I'm going to show you here on the chart how we can identify this so-called "line of fire," which is the initial battle line within the mini-index chart. So
[01:20] region and pinpoint the entry point. The chart must have the here's our 5-minute chart for the mini-index. We need to include indicator I'm going to put here is the financial volume. Right-click,
[01:34] financial volume. Right-click, insert bookmark. Let's define financial volume as the indicator here. In the window below, click OK. It comes with this pattern here, right-click on the
[01:48] bars, and set the coloring type there as low and high colors. And in this volume, we're going to need an average of the last 20 volume bars. moving average. We're going to set this
[02:00] moving average. We're going to set this moving average to a period of 20. We will select her. Let's identify it with the color white, increase its thickness so that we have a good visualization of this average.
[02:14] chart and place a very important indicator within it . Right-click, insert bookmark. We're going to add bookmark. We're going to add the VAP indicator to our chart. It's the standard one,
[02:27] okay? So, select it there, and click OK. There's not much that needs to be changed. just going to increase the thickness a little so we can see it properly so we can see it properly throughout the video.
[02:45] identification easier, I'm going to add a perfumery label to the chart, right? Well, I'll certain candlesticks for me. So, I'm going to ask you to place the indicator here candle numbering. It's simple, straightforward, insert indicator.
[02:58] And we're going to send him to fetch a counter here, which is a candle counter. counter here, which is a candle counter. I did it like this: you'll put numbers on the candles, candle 1, 2, 3, and so on. Very good. From now on, I will
[03:12] discuss with you the chart so that we can make entry points. The goal here is for us to enter the market at a time when it is defining where it
[03:25] will operate. It's not an absolute rule. There are days when the market will remain sideways time, 70-80% of the time, it settles in the first few minutes, during the first schedules there? Between 9:00 AM and 9:15, 9:20. He more or less
[03:42] has that definition. Since I'm using the 5-period chart, we can deduce that the first three candles from 9 to 9:15 will define a battle range where sellers and buyers are seeking a resolution. From there, it will all come
[03:55] together. So when they define this study model, it allows us to also work with them on a specific point and for us to be able to take always going to look at the chart here and let it happen, let
[04:08] the first three candles roll, and then we're going to mark the high and low of the candle set, which was actually this one here. So here inside we have what rectangle here to identify it. So, look, this range has been created here,
[04:25] when there is a breakout from this range. But the breakout from this range needs to be clearly identified. For example, here we had confirmation with this candle us to have a trade, we need a breakout from this
[04:39] initial range of the day. What else will give me confirmation? So, which side will higher than VOAP. The rupture is above the VOAP. That already gives me an idea of what to buy. I'll also check the volume down here . It's the first, second, and third
[04:55] candle. This candle that broke out here has an candles, right? Look, based on my average here, the closing volume n't matter much, but what's important is that it's above this average of 20. That
[05:10] confirms, for me, an entry. Once this entry is made, my stop loss will be at the VOAP (Volatility, Average Price), or if the candle that triggered this entry is below the VOAP, I will use it as the base. I will then place the stop loss precisely here at the low of
[05:25] this candle or at the VAP (Volume Per Action). If the candle is above the VOAP (Volume of Average Price), I place the stop below the VOAP, use the Fibonacci projection tool , click here where the stop is, drag it to the entry point, and from there I will project
[05:39] my risk upwards by one and a half times. We then ended up with the stop loss projected down here then ended up with the stop loss projected down here at 215 points, and my target was set at one and a half times. My risk level was 315 points. Is that clear? I hope so. If you did
[05:53] n't get it, I ask that you pause now and come back, take the full explanation now and come back, take the full explanation here to make our study easier a color rule here for these candles. Right-click, create
[06:06] color rule. And we're going to put the following rule here, see. New rule. Here's the counter, the candle counter. Click and drag and drop it here. If the drag and drop it here. If the candle counter is
[06:20] candles, right? If it's less than four, I want him to apply black here so it's want him to apply black here so it's easily identifiable there. save. He's going to ask for a name for our strategy.
[06:33] strategy. Let's put the firing line here. Give it whatever because of the name of what I'm talking about here, Line of Fire. Save. Yes. Done. And now I'm going to apply it. I'm looking at the candlesticks, at the chart, right? And I'll insert
[06:49] candlesticks, at the chart, right? And I'll insert a rule. Insert coloring rule. You can go to the website and search. Line of fire. Look what he did to my which for me will act as the range area, will
[07:04] be dark. So, from here, I start to identify what I want there. From there, we will identify it. So, we have an entrance there. So, every day you're going to do the following: you're going to let the first three candles pass,
[07:18] and then we're going to observe the volume down here. Let's schedule it there. You can put a rectangle, right, at the maximum of the movement, at the minimum of the movement. Drag. When we have a breach in this region, we'll have an operation planned.
[07:31] So, for example, here he makes the break. You've already seen that I explained it there. And then we project everything forward. Let's take a look. Well, three candles, right? Oh, the first three candles are dark. I'll
[07:44] mark here the highest point and the lowest point of the movement. candles inside. I'll only act when there's a breakout of the range, okay? Next, then. I'm seeing selling volumes, the market is falling. What am
[07:58] I going to do? When this candle closes here, or after range, I place a sell order at this point. Then you'll always see validation below the VAP, negative candles, negative volume
[08:11] above 20. So I really have the idea of a sell signal. I'm picking up my reminder, I need to get my projection tool. Where is the movement? Look, the high of the candle that triggered it
[08:26] is here, but I'm going to place the stop. To where? navel na do momento, ó. I grab it here where navel na do momento, ó. I grab it here where it is right now, click, drag it to the breakout point. And then we're going to project the target
[08:39] And then we're going to project the target downwards. Then, one and a half times. The risk was that he came all the way here, didn't set a stop loss, and came back, hitting the target down here, okay? way, remembering that it's one trade per day,
[08:52] taking that first movement of the day, it usually works like this, see. We have a new formation here. So I have the maximum and minimum values of the movement. A range was created. So, it's very favorable here for selling because I have
[09:06] favorable here for selling because I have to the volume. Oh, I have some volume here, some buying volume came in on the third candle. So take a look at that. But anyway, I'll put
[09:19] buying spree kicked in, and he returned. Oh, it didn't activate. It didn't activate. It will only activate when it breaks the range. Orders there, oh. What did he do next? He came here to break through my range. It triggered a sell order here in my range. I'm going to
[09:33] make my projection. I can use that as a projection; I can use the vapor pressure (VAP) or, if the candle was above the VAP, I can use the candle's high. Project the image up to the entry point and it will project the target downwards for me
[09:46] . One and a half times. My risk, I observe, is that he comes and grabs the target down here, okay? So it's a region of great definition. When he decides which boost. That's how you can take advantage of this movement in a very profitable way.
[09:59] I mentioned that this market movement is indeed visible on the chart, which sincerely hope that today's lesson and only thing I ask is that you subscribe to the channel, activate the bell
[10:13] new content we post, and of course, leave a like so that we can be motivated to produce more and more lessons like this for on Instagram too! Thank you so much for staying with me for
[10:26] this video. May God immensely bless your life. God. Go!




⚡ Saved you 0h 10m reading this? Transcribe any YouTube video for free — no signup needed.