
AI Summary
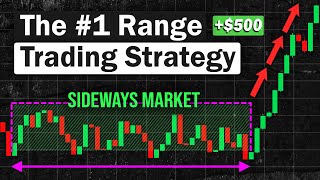
This video explains how to profit from ranging (sideways) markets in crypto, forex, and stocks. It covers identifying ranging markets through market structure, drawing key support and resistance levels, and using entry signals based on price bounces. It also introduces a breakout strategy for narrow ranges and demonstrates the use of grid trading bots, with a sponsored segment for the Pinex platform.
Chapters
Trending markets move in a clear direction (uptrend/downtrend) and are preferred by traders for predictability. Ranging markets move erratically without a definitive direction, making them harder to predict and causing most indicators to fail.
Studies show financial markets trend only about 30% of the time and range about 70% of the time. Therefore, traders should learn to profit from ranging markets rather than avoid them.
A simple trick is to watch market structure. In an uptrend, price forms higher highs and higher lows. When price fails to break previous highs twice and moves sideways, the structure shifts to a range. Similarly, in a downtrend, failure to form lower lows signals a range.
Once a range is identified, draw resistance above and support below. These levels define the trading zone and help determine if the market is still ranging. Note that price may not touch levels perfectly; treat them as areas, not exact lines.
Take advantage of price bouncing off key levels. Look for a pattern where price reverses from support/resistance. When price hits a level again, based on previous bounces, it may reverse again, offering a trade opportunity.
Price may react to new key levels that form along the way, not just the original ones. Always keep an eye on new levels because price can shift its reaction point.
When the range is too narrow, use a breakout strategy. Identify narrow ranges on lower timeframes (1-15 min). Draw key levels with some buffer to avoid false breakouts. Wait for a momentum candle (big or multiple medium candles) to break the level before entering.
Grid bots automatically place buy/sell orders above and below price, profiting from price fluctuations. They work best in ranging markets and weak uptrends, but underperform in downtrends and strong uptrends.
Steps: 1) Create a free account on Pinex. 2) Find an asset in a range (e.g., DOGE/USDT). 3) Draw support and resistance. 4) Go to Trade > Grid Trading > Create. 5) Set lower price (support), upper price (resistance), number of grids (e.g., 30), and total investment. 6) Click Create to start. To close, click Cancel and confirm.
Ranging markets are common and can be profitable with the right strategies: identifying market structure, drawing key levels, using bounce entries, and applying breakout or grid bot strategies. The video provides practical steps and a sponsored demo of the Pinex grid bot.
Mentioned in this Video
Tutorial Checklist
Study Flashcards (8)
What percentage of time do financial markets trend vs. range?
easy
Click to reveal answer
What percentage of time do financial markets trend vs. range?
Markets trend about 30% of the time and range about 70% of the time.
01:11
How can you identify a ranging market using market structure?
medium
Click to reveal answer
How can you identify a ranging market using market structure?
Look for failure to form higher highs (in an uptrend) or lower lows (in a downtrend) twice, indicating a shift to sideways movement.
01:52
Why do most indicators fail in ranging markets?
easy
Click to reveal answer
Why do most indicators fail in ranging markets?
Indicators like MACD produce multiple false signals in ranging markets, leading to losing trades.
00:58
What is the entry signal for a range trading strategy?
medium
Click to reveal answer
What is the entry signal for a range trading strategy?
Price bouncing off key support or resistance levels, based on a pattern of reversals at those levels.
04:57
What is a momentum candle in breakout trading?
medium
Click to reveal answer
What is a momentum candle in breakout trading?
A big candle or multiple medium-sized candles that break out of a key level, indicating a strong move.
08:27
In which market conditions do grid bots perform best?
medium
Click to reveal answer
In which market conditions do grid bots perform best?
Grid bots work best in ranging markets and weak uptrends where price fluctuates but moves sideways or slightly up.
10:37
Why do grid bots underperform in strong uptrends?
medium
Click to reveal answer
Why do grid bots underperform in strong uptrends?
Because the bot only buys when price goes down; in a strong uptrend, price rarely pulls back, so the bot doesn't get buy opportunities.
11:28
What are the steps to set up a grid bot on Pinex?
hard
Click to reveal answer
What are the steps to set up a grid bot on Pinex?
Create an account, find a ranging asset, draw support/resistance, go to Trade > Grid Trading > Create, set lower/upper price, grids, investment, and click Create.
11:53
💡 Key Takeaways
Markets Range 70% of the Time
This statistic justifies the importance of learning range trading strategies.
01:11Market Structure Shift
A practical technique to spot ranging markets early by observing higher highs/lows failure.
01:52Momentum Candle to Avoid False Breakouts
A simple rule to filter out false breakouts in narrow ranges.
08:27Grid Bots Automate Range Trading
Introduces an automated solution for profiting from ranging markets.
09:20Grid Bots Fail in Strong Trends
Highlights the limitations of grid bots, crucial for risk management.
11:28Full Transcript
[00:02] built-in trading bots in this video i'll be showing you the best strategies that you can use to earn profits on a ranging market so first an important concept that you need to understand is that in the world
[00:16] types of markets that exist trending markets and ranging markets trending markets is when the price is clearly moving in a definitive direction if it's going up it's called an uptrend and if it's going down it's called a
[00:32] now usually this is the type of market that traders prefer to trade on because the movement of a trending market tends to be more predictable markets which is a type of market where the
[00:45] price moves erratically without having a definitive direction now usually traders tend to avoid this type of market because it's a lot harder to predict where the price will go next another reason on why traders tend to
[00:58] avoid ranging markets is because most indicators tend to not work properly on them an example of that will be the mac the indicator so here if we try applying the mac the indicator on this ranging market you can see that it's showing us
[01:11] multiple false signals and as a result we ended up with mostly losing trades ranging markets are pretty much unavoidable in fact studies shows that the financial markets only trend about 30 percent of the time while moving on a
[01:26] sideways range about 70 percent of the time this means that most of the time markets are actually ranging and so instead of trying to avoid them altogether why not try to take advantage of them and that is why in this video
[01:39] strategies that you can use to earn profits on a ranging market so strap in profits on a ranging market so strap in because we're going to go very in-depth so first in order to earn profits on a ranging market we first need to know how
[01:52] to actually identify them and normally ranging markets are a lot easier to be identified after they have already formed but forming it tends to be harder to spot and so a simple trick that i like to use
[02:06] to identify ranging markets as they're forming is to pay close attention to the market structure let me show you an example so here we can see that initially the market was clearly on an uptrend now ask
[02:18] yourself this why is this an uptrend well it's because of how the price is structured here we can see that the price went up made a pullback and comes back up again however notice that as the price goes up
[02:31] it actually breaks the previous highs and it did this multiple times forming what's called a higher highs and higher lows because the highs and lows of the price is constantly getting higher and higher which is why this whole movement
[02:44] is classified as an uptrend but notice what happens next we can see that the price went up comes back down but this time it failed to break above the previous highs and again you can see it happening the
[02:57] second time price went up comes back down but failed to break above the and so at this point we can clearly see that the market structure had already shifted it went from forming higher highs and higher lows at first to then
[03:11] failing to form another higher highest twice and started moving sideways so based on this market structure we can already identify that the market is currently ranging now let's look at another example
[03:23] so here we can see that initially the price was on a clear downtrend as it forms lower highs and lower lows next we can see that the price went down comes back up but failed to form another lower lows
[03:37] we can see that the price goes back down the second time comes back up and again failed to form another lower lows and so based on this we can clearly see that the market structure had already shifted it went from being on a clear downtrend
[03:52] to now moving within range now once you've identified a ranging market the next thing you want to do is drawing the key levels and so you can draw a level of resistance above and a level of support below here
[04:05] now there are a couple of reasons on why we draw these key levels the first reason is because we want to determine the area of where the price is still meaning if the price goes out of one of these key levels it shows us that the
[04:18] market is no longer ranging the second reason is because we're establishing our trading zone so as long as the price stays within the zone we can still trade it using our range market strategy but bear in mind it's
[04:31] very rare to find ranging markets that moves perfectly between key levels like most ranging markets will actually look like this where the price may not touch the key levels perfectly as you can see there are some candles that overlap the
[04:44] levels and even some that are not touching the levels at all and this is perfectly fine because remember we're treating support and resistance as a general area not as solid lines now once you've identified your key
[04:57] levels the next step is finding your entry signal so for your entry signal you want to take advantage of the price bouncing off those key levels let me show you an example so here we can see that at first the
[05:09] price was in a small uptrend before it started moving sideways and so we can draw a level of resistance above and a level of support below here now if you look closely you'll actually notice a pattern every time price hits a
[05:22] key level it tends to reverse from it as you can see price went down hits the key level and reverses upwards again it went down hits the key level and reverses and the same thing is happening above here price went up hit and reverses
[05:37] downwards again it went up hit and reverses downwards can see that it's touching the resistance level once again and so based on the previous pattern it may indicate that the price will reverse from this
[05:50] level as well so this is a good opportunity to take a short position hasn't hit the key level like in this example
[06:03] range and so you can draw a level of resistance above and a level of support next you can see that in the past price clearly respect these levels as it tends
[06:15] to bounce off after hitting them however if you look at the recent price we can see that the price went down and reverses upwards immediately without even touching the support level and after that
[06:28] price went down the second time and reverses upwards however if you look closely you can actually see that the price is reacting to this new key level instead of the old one this is exactly why you should always keep an eye on new
[06:40] key levels that may form because price doesn't have to react to just one key level exclusively it can always react to new ones that forms along the way now moving on another type of ranging markets that you
[06:53] may encounter is called narrow ranging markets which is when the distance between the upper and lower levels are too narrow as a result there isn't much room for the price to move around this means that you won't be able to trade it
[07:05] i showed you earlier and so the best way to take advantage of this type of ranging market is to trade it using a breakout strategy instead and markets are moving on a narrow range like this it indicates that the price is
[07:20] consolidating and usually after the price consolidates a breakout tends to happen afterwards so if you know how to trade breakouts before the breakout happens and make a profit
[07:33] so this is how the strategy works the first step is you want to find a narrow ranging market which can be identified by multiple small candles moving sideways erratically like this and a quick tip you can find them a lot
[07:46] easier on lower time frames such as the 1 minute to 15 minute time frame now once you've identified a narrow ranging market the next step is drawing the key levels and so you want to draw a level of resistance above and a level of
[07:59] support below here but remember don't draw them too closely make sure to give in between so that we can avoid false breakouts later on now once you've drawn the key levels the next step is figuring out the breakout
[08:13] direction will it happen to the upside or the downside now keep in mind in a narrow ranging market false breakouts happen very often and so a simple trick that i like to use to avoid false breakouts is by waiting
[08:27] for a momentum candle to break out of the key level so a momentum candle could be in the form of a big candle or multiple medium sized candles with the works here we can see that the price goes up
[08:41] and breaks above the resistance level however notice that the size of the candle that broke out is way too small to be classified as a momentum candle meaning you don't want to take any positions yet because this may just be a
[08:53] next we can see that the price came back down gets back up and breaks above the resistance level once again however you can see that this time it's a big green candle that broke out which
[09:06] means we now have a momentum candle so based on this we can conclude that the upside and so this is a good opportunity to and so this is a good opportunity to take a buy position
[09:20] on another way of earning profits from a ranging market is by utilizing what's called a grid bot which is a trading bot that is based on the grid trading strategy basically how it works is that the bot will automatically place a
[09:33] series of buy and sell orders above ends below the price forming somewhat of a grid shape as shown here next every time price goes down to the grid below it it will automatically take buy positions
[09:46] and every time price goes up to the grid above it it will automatically sell those positions and make a profit and it will do this continuously over so as price goes down the bot will keep buying and as price goes up the bot will
[09:59] keep selling for profit and so as long as the price stays within the range of the grid the bots will keep profiting from the flock trading price and remember grid bots are fully automated meaning they're perfect for
[10:11] traders who wants to profit from a ranging market but are too lazy to trade now most platforms will actually charge you money to use a grid bot however if you want to get it for free you can use the pinx trading platform just click the
[10:25] link below register deposit your money and you can use the bot right away for free but of course grid bots aren't perfect just like any other strategy there are certain types of market where the bot
[10:37] works best and some where the bot underperforms and so the first type of market where the bot works best are ranging markets where the price fluctuates but remains moving sideways
[10:49] the next type of market where the grid bot works best are weak uptrend markets where the price is overall uptrending but still fluctuates in the process now let's talk about the different types of market that you want to avoid if
[11:03] you're using a grid bot first are down trending markets which downwards because remember the bot is designed to keep buying if the price goes down and sell for a profit if the price goes up and so if the price is
[11:16] continuously going down it means that the bot will only keep buying without making any profit the next type of market that you want to avoid are strong uptrending markets which are markets where the price moves
[11:28] continuously upwards now the reason for this is because gridbot will actually underperform on this type of market because remember the bot is designed to only take buy positions if the price goes down meaning
[11:41] if the price continuously goes up it means that the bot won't have a chance to take any buy positions therefore it won't work properly and so now that you know which types of market works best for the grid bot i am
[11:53] now going to show you how to set up the bot on the pinx platform so the first step is obviously you need to have an account on the pinx website register for free now after you've made your account the
[12:08] next step is you want to find an asset that is currently moving within range structure technique that i showed you in so in this case i'm choosing to trade the dodo usdt for our chart because you
[12:22] currently ranging as it's moving sideways now once you've identified the asset that you want to trade the next step is drawing the key levels and so you can draw a level of support above and a
[12:35] level of resistance below here now once you've identified the key level the next step is applying the grid bot so here you click trade go to grid trading and click create next you can choose whether you want an
[12:49] ai to set the settings for you or you can just set it manually personally i more accurate now for a lower price you want to insert the value of your support level in this case my support level is at 1.103 and so
[13:04] i'm going to insert it here next for your upper price you want to enter the value of your resistance level and as you can see my resistance level is at 1.359 so i'm going to insert it here
[13:18] this value depending on how much grits you want to be placed in this case i'm using 30 grids next for total investment you can set how much of your total capital do you want to trade using the bot once you're
[13:32] done click create and the bot should start running automatically now if you want to close your positions or take profit you can make the bot stop by clicking cancel go to please cell and click confirm
[13:45] and so that's how you use the grid bot on the pinex platform now asides from the grid bot pynex also offers other types of bot as well which is available for free just click the link below register deposit and try
[13:57] these bots out yourself so big thanks to pinex for sponsoring this video and so that's all for today thank you so much for watching and i'll see you in much for watching and i'll see you in the next video



