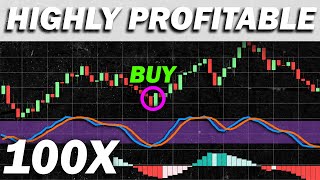

The #1 Trading Mistake That Kills Win Rate
42sThis segment exposes a common mistake traders make with the Stochastic indicator, promising a solution that hooks viewers seeking to improve their trading.
▶ Play Clip"Delivers a concrete strategy with backtested results, but the 'proven 100x' claim is misleading; the actual win rate is 56%."
This video presents a trading strategy that combines the Stochastic, RSI, and MACD indicators to generate high-probability entry signals. The strategy uses Stochastic for overbought/oversold levels, RSI as a trend filter, and MACD for momentum confirmation, with a backtested win rate of 56% over 100 trades.
The video introduces a trading strategy combining Stochastic, RSI, and MACD indicators, claiming a high win rate proven by backtesting 100 times.
Stochastic generates the main entry signal, identifying overbought and oversold levels. It has two lines: K% (blue) and D% (orange). Common mistake: trading solely on overbought/oversold signals without confirmation.
RSI is used as a trend confirmation indicator, not overbought/oversold. Set both levels to 50; if RSI is above 50, uptrend (only buy); below 50, downtrend (only sell).
MACD detects momentum. Common use: crossovers, but false signals in sideways markets. In this strategy, MACD confirms momentum: buy when MACD crosses above signal line, sell when crosses below.
Buy: Stochastic K and D lines hit oversold, RSI above 50, MACD crosses above signal line, and Stochastic not yet overbought.
Sell: Stochastic K and D lines hit overbought, RSI below 50, MACD crosses below signal line, and Stochastic not yet oversold.
For buys, stop loss below nearest swing low; for sells, above nearest swing high. Profit target set at 1.5 times the stop loss distance.
Backtested 100 trades over 134 days with $1000 capital, 200x leverage, risking 0.5% per trade. Win rate 56%, max wins in a row 5, max losses 3, total profit $280.41 (28% gain).
Limit stop loss to 0.15% to avoid large losses when swing high/low is far away.
Avoid opening new positions until previous trade is closed to simplify management and avoid missing signals.
The strategy combines three indicators to filter signals and improve win rate, with a backtested 56% win rate. The presenter emphasizes risk management and discipline, and encourages subscribing.
What are the three indicators used in the strategy?
Stochastic, RSI, and MACD.
00:16
How is RSI used in this strategy?
As a trend confirmation indicator: above 50 means uptrend (only buy), below 50 means downtrend (only sell).
01:39
What is the common mistake when using Stochastic alone?
Taking buy/sell positions every time the indicator hits oversold/overbought without confirmation, leading to low win rate.
00:58
What are the conditions for a buy signal?
Stochastic K and D lines hit oversold, RSI above 50, MACD crosses above signal line, and Stochastic not yet overbought.
03:17
What are the conditions for a sell signal?
Stochastic K and D lines hit overbought, RSI below 50, MACD crosses below signal line, and Stochastic not yet oversold.
04:03
What is the recommended profit target?
1.5 times the stop loss distance.
04:53
What was the win rate in the backtest?
56%.
08:19
What is the recommended maximum stop loss limit?
0.15%.
09:06
Why should you avoid opening multiple trades at once?
Managing more than one trade is very hard.
09:46
Common Stochastic Mistake
Highlights a frequent error that reduces win rate, emphasizing the need for confirmation.
00:58RSI as Trend Filter
Shows a non-standard use of RSI to filter trends, adding value to the strategy.
01:39Backtest Win Rate 56%
Provides concrete evidence of the strategy's performance, supporting its credibility.
08:19Limit Stop Loss to 0.15%
Practical risk management tip to prevent oversized losses.
09:06[00:03] and profitable trading strategy that is proven to have a high win rate and at the end of the video i'm going to show you proof of it having a high win rate by back testing the strategy 100 times
[00:16] so without further ado let's get on with the video for this we are using a combination of three indicators the stochastic rsi and macd first let's start with the
[00:31] because that will generate our main entry signal indicator that does a very good job of identifying overbought and oversold levels on the market
[00:45] it consists of two parts the blue line which is called the k percentage and the orange line which is called the d percentage one of the most common mistakes that traders make when using this indicator
[00:58] by itself so they take a buy position every time the indicator hits oversold and they take a sell position every time the indicator hits overbought if you're still using the indicator this
[01:11] way you will get a very low win rate instead you need to combine the other indicators to further confirm your analysis and so let's move on to the second indicator for our strategy
[01:24] which is the rsi the rsi used in trading and a popular way of using the rsi is by trading it as an overbought and oversold indicator however
[01:39] for this combination strategy we already have the stochastic to do that job so having two indicators that give the same signals is quite useless instead we are using the rsi as a trend confirmation indicator and
[01:54] to do that first we need to go to the indicator settings and change both of these levels to 50. so now we have a single line in the middle like this and the way we use it to confirm a trend
[02:07] is very simple if the rsi is above the middle line it means that the price is on an uptrend so you only take buy positions and if it means that the price is on a downtrend so you only take
[02:22] downtrend so you only take cell positions now let's move on to the third indicator which is the macd the macd is one of the most popular indicators that does a very good job of detecting momentum
[02:35] and a common way of using the macd is by taking a buy position if the macd line crosses above the signal line and taking a cell position if the macd line crosses below the signal line however this strategy only works if the
[02:51] market is trending if the market is moving sideways the macd often gives false signals so that is why for this combination strategy we are not going to buy or sell just
[03:03] because the macd crosses over instead we are using it to give extra and making sure that the momentum is on our side our side and so this is how the stochastic rsi
[03:17] and macd strategy works first let's start with their entry signal to identify a buy signal the first step is you want to look at the stochastic and wait for both the k and d lines to
[03:31] hit oversold then you want to use the rsi to confirm by making sure that it's above the middle line the next step is you want to use the macd to confirm the upwards momentum
[03:44] by waiting for the macd line to cross above the signal line once this happens however you still need to make sure that both of the stochastic lines still hasn't hit overbought yet and if all the rules were met you take a
[03:58] buy position let's move on to finding cell signals the first step is you want to look at the stochastic and wait for both the k and d lines to hit overbought
[04:12] then you want to use the rsi to confirm the downtrend middle line the next step is you want to use the macd to confirm the downwards momentum by waiting for the macd line to cross
[04:26] below the signal line and you still need to make sure that both of the knd line still has it hit oversold sell position [Music]
[04:39] now for your exit strategy if you took buy positions you want to place your stop loss below the nearest swing low your stop loss similarly if you took cell
[04:53] you want to place your stop loss above the nearest swing high and set your profit target at 1.5 times your stop loss so now before we back test this strategy 100 times
[05:07] chart we can see that both of the k and d lines is that oversold meaning we're going to take a buy position then you want to confirm the uptrend by
[05:19] making sure that the rsi is above the middle line the next step is you want to use the macd to further confirm the upwards momentum by waiting for the macd line to cross above the signal line
[05:32] and you still need to make sure that both of the stochastic lines still overbought yet once all the rules are met you take a buy position now for your stop loss
[05:44] you place it below the nearest swing low and set your profit target at 1.5 times your stop loss let's look at another example in this we can see that both of the k and d lines is at overbought
[05:58] position then making sure that the rsi is below the middle line the next step is you want to use the macd to further confirm the downwards momentum
[06:12] by waiting for the macd line to cross below the signal line and make sure that both of the k and d lines still hasn't hit oversold once this happens you take a cell position
[06:24] and for your stop loss you place it above the nearest swing high and set your profit target at 1.5 times your stop loss so now i'm going to prove that this strategy actually works
[06:36] by back testing it 100 times for this back test time frame with a starting capital of 1000 and for our money management we are risking
[06:49] trade and for each trade we are using 200 times leverage by the way you can download this back in the description below so without further ado let's start back testing
[08:03] strategy 100 times the results are in it took us 134 days to reach 100 trades and out of that 100 trades we received a very good win rate of 56 our most wins in a row was five
[08:19] and our most losses in a row was three and in total we made a profit of 280 dollars and 41 cents which equates to around 28 and 41 cents which equates to around 28 overall gain of our 1 000 capital
[08:38] you can implement to further increase the win rate for the strategy the first one is limiting your stop loss position you want to set your stop loss at the
[08:53] nearest swing high however in this particular trade you can see that the swing high is too far away from the price and it can potentially give you a massive
[09:06] loss and that is why i recommend limiting your stop loss to only 0.15 so no matter how far your stop loss is your loss will never exceed 0.15 percent
[09:20] another tip that you can use is don't open a new position if you haven't closed your previous one let me explain if you're taking a position you only exit a trade if the price either hits
[09:33] your stop loss or profit target however there are times where the trade takes a long time to hit a target and as a result you will miss a couple of entry signals along the way
[09:46] which is perfectly fine i recommend sticking to only one trade at a time because managing more than one trades is very hard
[09:59] high win rate strategy that you can immediately use right now all i ask for in return is for you to invest 2 seconds of your time into and subscribe to the channel it literally takes only 2 clicks
[10:13] but it means so much to me and you can also check out my other videos as well so thank you guys for watching and i'll see you in the next video




⚡ Saved you 0h 10m reading this? Transcribe any YouTube video for free — no signup needed.