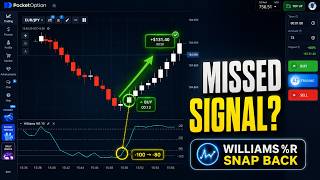

The #1 Indicator Mistake Beginners Make
56sExposes a common misconception about Williams %R that many traders will relate to, making it highly shareable.
▶ Play Clip"The title is somewhat generic, but the content delivers a clear, structured strategy with honest examples, including a losing trade, which adds credibility."
This video presents a 1-minute binary options trading strategy called the Williams %R Snapback, designed to catch market reversals after extreme panic. The strategy uses the Williams Percent R indicator on a 15-second timeframe to identify oversold and overbought conditions, entering trades when the indicator snaps back from extremes. The presenter emphasizes the importance of using this strategy in ranging markets and includes a losing trade to provide honest education.
Introduces the Williams %R Snapback strategy for 1-minute binary options, focusing on catching market panic and exhaustion points.
Emphasizes that the content is educational, not financial advice, and highlights the risks of binary options trading, recommending demo account practice.
Instructs to open a Pocket Option chart, switch to the 15-second timeframe, and add the Williams Percent R indicator with a period of 10.
Explains that Williams %R moves from 0 to -100, with -100 indicating extreme oversold (panic) and 0 indicating extreme overbought (euphoria).
The buy signal occurs when Williams %R falls to -100 and then snaps back above -80 within 1-2 candles. Enter a buy trade with a 1-minute expiry.
The sell signal is the mirror: Williams %R hits 0 and then snaps back below -20 within 1-2 candles. Enter a sell trade with a 1-minute expiry.
The key is a sharp, fast rejection (snap), not a slow drift. This sharpness indicates an emotional move, not a real trend.
Do not use this strategy in strong trending markets. If the indicator is pinned at the extreme for 5-7 candles, it's momentum, not exhaustion. The strategy works best in ranging or choppy markets.
Mentions a free PDF guide with buy/sell checklists and an entry card, with a link in the description.
Shows a live example of a buy setup during a heavy sell-off, where the indicator hits -100 and then snaps back above -80, leading to a successful trade.
During the trade, it's important to watch the indicator, not the candle noise. The indicator holding its ground confirms the move.
Another buy setup is shown with a sustained drop, the indicator hitting -100, and a snapback above -80, leading to a successful trade with a strong bullish candle.
Presents a losing sell trade. The signal appeared valid, but the broader market had strong upward momentum, causing the reversal to fail. This highlights the importance of market context.
The loss occurred because the setup was in a strong trend, not a ranging market. The strategy works best in choppy conditions, and this is a lesson in understanding the strategy's limits.
The Williams %R Snapback strategy is effective in ranging markets but fails in strong trends. The video provides honest education by showing both winning and losing trades, emphasizing that understanding market context is crucial for success.
What is the range of the Williams %R indicator?
It moves from 0 down to -100.
01:07
What does a Williams %R reading of -100 indicate?
It indicates extreme oversold conditions, or complete panic on the downside.
01:07
What is the buy setup for the Williams %R Snapback strategy?
Williams %R falls to -100, then snaps back and crosses above -80 within 1-2 candles. Enter a buy with a 1-minute expiry.
01:37
What is the sell setup for the Williams %R Snapback strategy?
Williams %R hits 0, then snaps back below -20 within 1-2 candles. Enter a sell with a 1-minute expiry.
02:05
What is the key difference between a 'snap' and a 'drift' in this strategy?
A 'snap' is a sharp, fast rejection, indicating an emotional move. A 'drift' is a slow, gradual curve, which is not a valid signal.
02:20
Why should you avoid this strategy in a strong trending market?
If the indicator is pinned at the extreme for 5-7 candles, it's momentum, not exhaustion. The strategy works best in ranging or choppy markets.
02:35
What was the reason for the losing trade shown in the video?
The setup was in a strong trend with real buying momentum, which caused the exhaustion signal to fail.
09:09
Understanding Williams %R
Clarifies the unique 0 to -100 scale of the indicator, which is a common point of confusion for beginners.
01:07Market Context is Crucial
Emphasizes that the strategy fails in trends, highlighting the importance of market context over a single indicator signal.
02:35Honest Losing Trade
The inclusion of a losing trade provides realistic expectations and a deeper understanding of the strategy's limitations.
07:12The Real Lesson
The loss is used to reinforce the rule about avoiding strong trends, making the educational point more memorable.
09:09[00:01] every chart where the market basically screams that it's exhausted and most traders completely miss it? Welcome back to Sam Trading Strategies. Today, I'm breaking down a 1-minute pocket option strategy I call the Williams percent R
[00:14] strategy I call the Williams percent R snapback or the extreme fade setup. The whole idea is simple. We're catching the market right after it panics. No trend just waiting for one very specific
[00:26] signal that tells us the move is done. Quick note before we start. This is purely educational, not financial advice. Binary options trading carries real risk and you can lose your investment. Always practice on a demo
[00:39] account first and never trade money you can't afford to lose. I'll also be showing you losing trades during this video because that's the only honest way to actually learn a strategy. If you're new here, hit subscribe and let's get
[00:51] into it. All right, open your pocket option chart, switch to the 15-second time frame and add just one indicator. Williams percent R period 10. That's it. No clutter, no five indicators fighting each other. One tool used correctly.
[01:07] Now, here's what most beginners get wrong about Williams percent R. It doesn't move like RSI from 0 to 100. It moves from 0 down to minus 100. When it touches minus 100, sellers have pushed price to an absolute extreme, complete
[01:23] price to an absolute extreme, complete panic on the downside. When it hits 0, buyers have done the same thing on the upside. These are what I call panic zones and panic never lasts long. That's our entire edge. So, let's talk about
[01:37] how we actually enter. The buy setup. Williams percent R falls all the way to Williams percent R falls all the way to minus 100. That's the extreme low. We don't jump in immediately. We wait. If within the next one or two candles,
[01:51] percent R snaps back and crosses above minus 80, that's our confirmation. Sellers are exhausted, buyers are taking over. We enter a buy trade with a 1-minute expiry. The sell setup is the exact mirror.
[02:05] Percent R hits zero, completely overbought. Within one or two candles, overbought. Within one or two candles, it snaps back below minus 20. Buyers are done, momentum is flipping. We enter a sell, same 1-minute expiry. The word I
[02:20] want you to remember is snap. Not a slow drift, not a gradual curve, a sharp, fast rejection. That sharpness is what tells us the move was emotional, not a real trend forming. Now, here's where most traders get hurt with this setup.
[02:35] And I'll be honest, I learned this by losing trades myself. Don't take this signal in a strong trending market. If price is moving hard in one direction and Williams percent R is staying pinned at the extreme for five, six, seven
[02:47] candles, that's not exhaustion, that's momentum. Skip it. This strategy works best when the market is ranging or choppy, where those extremes actually mean something. In a moment, I'm going to show you side-by-side a clean setup
[03:00] versus a trap. That one visual comparison is what separates a good week from a frustrating one. So, stay with me. Oh, and before we get to the charts, I've put together a free PDF guide for this strategy. It has the full buy
[03:14] checklist, the sell checklist, and a quick reference entry card you can keep right next to your screen. The link is in the description. Grab it now so you coming up. Let's get into the live charts. Look at the chart right here.
[03:28] Price has been in a heavy sell-off for several candles in a row. Big red bodies, very little recovery. The kind of drop where most traders panic and either chase the move down or freeze completely. But I'm not looking at the
[03:40] candles alone. I'm watching what Williams percent R is doing at the bottom of the screen. And right there, the indicator has pushed deep into the extreme oversold zone, scraping the floor at minus 100. That's our first
[03:53] condition. The market has hit complete panic on the downside. Now we don't jump in immediately. We wait for the confirmation. And within the very next candle, Williams percent R snaps back sharply above minus 80. That's the
[04:06] signal. Sellers are exhausted, buyers are stepping in. And I hit buy. No guessing, no emotion. Just waiting for the chart to tell me what to do. Now here's the part most trading videos completely skip. What happens while the
[04:21] trade is actually running? Look at the chart now. The candles are choppy. They're not flying upward in a straight line. There are small red candles mixed in. And if you're watching this in real time, your brain starts
[04:33] scroll your eyes down to Williams percent R. That green line is not going back down. It's climbing. The indicator that gave us the entry signal is now holding its ground and confirming the
[04:46] move. This is exactly why we follow the indicator, not the noise on the candles. The trade is alive. The signal is holding. Now we just let the clock run out and then look at the screen. Green.
[04:59] Confirm profit. All right. Let's find the next setup together. Look at the left side of this chart. What do you see? Candle after candle of selling. It's not just one or two red candles. This is a sustained aggressive drop
[05:14] that's been going on for several candles in a row. The kind of move where sellers feel completely in control and buyers are nowhere to be seen. Now look at Williams percent ER at the bottom of the screen. It has been
[05:26] dragged all the way down deep into that extreme oversold zone. Right at the floor of minus 100. The market is screaming exhaustion. But remember, we still don't enter yet. The rule is clear. We need the snapback confirmation
[05:40] first. And right there, Williams percent R turns. It lifts away from the extreme and begins crossing back above minus 80. That sharp little turn on the indicator is our green light. The sell-off has lost its fuel and buyers are starting to
[05:52] push back. I hit buy immediately. Trade is placed, confirmed on screen, 1-minute expiry. Clean signal, clean entry. Exactly the setup we've been waiting for. Now, watch what happens next because this is where the strategy
[06:05] really shows its character. Look at that candle. Right after our entry, a strong tall white candle forms. Buyers step in hard and fast pushing price up sharply from the bottom of the drop. This isn't a slow grind upward. This is momentum
[06:19] shifting in real time, right in front of us. And this is exactly the kind of price reaction we expect when Williams percent R snaps back from a genuine exhaustion point. Now, look at the indicator at the bottom.
[06:31] significantly. It's moved well away from the extreme low and is rising with confidence. The signal that told us to enter is now tracking the move beautifully, confirming that the buyers are actually
[06:44] in control of this bounce. The trade is running, the clock is ticking down, and everything on the screen is telling the same story. The snapback is real and the trade is moving in our direction. And the result? Green, confirmed. Trade
[06:58] But right here, this is the Williams percent R snapback working at its best. Four setups, four clean signals, four confirmed results. Now, let's find another perfect trade setup on the chart. Now, here's the moment I promised
[07:12] you, a losing trade. And I'm not going to hide it, skip over it, or make excuses for it. We're going to go through this one just as carefully as the winning trades because this is where the real education is. Look at the
[07:25] chart. Price has just come off a strong extended rally, multiple big white candles pushing up hard. And right at the top of that move, a red candle prints and Williams percent R has climbed all the way up to the extreme
[07:38] overbought zone, touching near zero. That's the first condition of our sell setup, extreme reached. Then within the next couple of candles, percent R begins to turn and crosses back below minus 20.
[07:51] Buyers appear exhausted. The rally looks like it's running out of steam. So, I enter a sell trade. Confirmed on screen, 1-minute expiry. On paper, this looks like a valid setup. The signal is there, the entry is clean,
[08:05] and that's exactly the lesson this trade is about to teach us. Watch what happens next, and watch it carefully, because this is what a trade going wrong looks like in real time. After our sell entry, price dips
[08:17] briefly. For just a moment, it looks like the move is working, but then buyers come back. A white candle starts forming, pushing price back up against our direction. We needed price to stay down, to keep falling, to confirm the
[08:30] exhaustion was real. Instead, it recovered. Now look at Williams percent R at the bottom. Instead of continuing to drop like we needed for a clean sell, it's flattening out and starting to curl back upward. That tells us something
[08:43] important. The momentum shift we thought we saw was not strong enough. Buyers were still in control underneath, and the so-called exhaustion at the top was not deep enough to produce a real reversal. The trade is in trouble and
[08:55] the clock is running out. And there it is, trade closed, zero return, a complete loss. Now let's be honest about what happened here. The signal looked valid, percent R hit the extreme, it crossed back, and I entered. But look at
[09:09] the broader chart structure. Before this setup, the market had been climbing with real buying momentum underneath. And when genuine trend strength is present, even a textbook signal can fail. This is exactly the warning I gave you earlier.
[09:23] The snapback works best in choppy ranging conditions, not when a trend has real power behind it. This is not a reason to abandon the strategy. This is a reason to understand it more deeply. And now you've seen both sides, the wins
[09:36] and the loss, on real live charts. That's what this channel is built on. Not a highlight reel, not false promises, just honest trading education. If that's what you've been looking for, subscribe and hit the bell so you don't
[09:49] subscribe and hit the bell so you don't miss the next video. I'll see you there.




⚡ Saved you 0h 09m reading this? Transcribe any YouTube video for free — no signup needed.