
Gold & Dollar: The Correlation Coefficient Indicator
45sThis segment reveals a specific indicator and a simple correlation strategy that is both educational and visually appealing for retail traders.
▶ Play Clip"Delivers a basic strategy but oversells with 'exact' and 'winning trade' — it's a simple correlation setup, not a guaranteed system."
This video presents a gold trading strategy based on the inverse correlation between gold (XAU) and the US Dollar Index (DXY). The creator outlines a step-by-step approach using TradingView's correlation coefficient indicator and supply zone analysis to time long entries on gold.
Open TradingView and search for XAU (gold) on one chart and DXY (dollar index) on a second chart.
Gold and the dollar typically move in opposite directions: when gold performs well, the dollar tends to weaken, and vice versa.
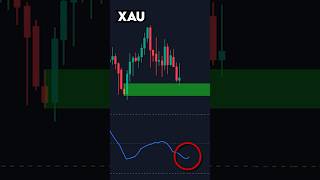
Add the 'correlation coefficient' indicator from the indicators tab. A reading below the dotted line confirms a negative correlation between gold and the dollar.
Wait for gold to hit a strong level while the correlation coefficient is negative. Then, check that DXY is in a strong supply zone; if not, skip the trade.
When both conditions are met (negative correlation and DXY in a supply zone), enter a long position on gold. This signals a high-probability winning trade.
The strategy leverages the inverse relationship between gold and the dollar, using technical indicators to confirm correlation and supply zones to time entries. It emphasizes patience and waiting for optimal conditions before entering a trade.
What two assets does the strategy use?
Gold (XAU) and the US Dollar Index (DXY).
00:02
What does a correlation coefficient below the dotted line indicate?
It confirms a negative correlation between gold and the dollar.
00:30
What condition on DXY is required before entering a long on gold?
DXY must be in a strong supply zone.
00:43
What is the typical relationship between gold and the dollar?
They move in opposite directions: when gold does well, the dollar does poorly, and vice versa.
00:16
Inverse Correlation Principle
Explains the fundamental market relationship that underpins the entire strategy.
00:16Correlation Coefficient as a Confirmation Tool
Shows a practical way to verify correlation using a technical indicator.
00:30Patience and Trade Filtering
Emphasizes waiting for optimal conditions, which is a key risk management principle.
00:43[00:02] recently. Here's my exact trading strategy I use in order to take First, go to TradingView. If you don't yet have it, I'll leave a link in my bio. Search XAU, which is gold. Next, open a second chart, DXY, which is the
[00:16] dollar index. Now, this is where things start to get interesting. Gold and the directions, meaning when gold does good, the dollar does bad. When the dollar you're thinking like I'm thinking, we can use this to our advantage. First, go
[00:30] to the indicators tab, search correlation coefficient, click this one. If the indicator is below this dotted line, that confirms they are currently negatively correlated. So, what you want to do, wait for gold to hit a strong
[00:43] correlation coefficient indicator is negative, which confirms there's negative correlation. If both of those are true, go to the DXY, make sure it's in a strong supply zone. If it's not, wait and don't take a trade. But, once
[00:57] supply zone, and the coefficient indicator is negative, that is your sign to enter long on gold. And just like to enter long on gold. And just like that, you got a winning trade.
⚡ Saved you 0h 01m reading this? Transcribe any YouTube video for free — no signup needed.



![BEST MACD Trading Strategy [86% Win Rate]](https://img.youtube.com/vi/rf_EQvubKlk/mqdefault.jpg)