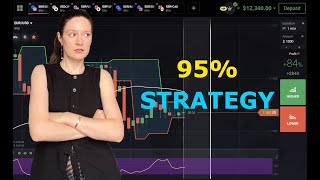

Unlock My 80% Win Rate Strategy
45sPromises a high win rate strategy, which is a major hook for traders seeking an edge.
▶ Play Clip"The title promises an '80% strategy' but the video only shows a few examples and lacks statistical evidence or backtesting to support the claim."
The video presents a trading strategy for IQ Option, based on a combination of three technical indicators with specific settings. The author claims the method is effective even in difficult market conditions due to the calculated indicator periods.
The strategy uses three indicators: Williams Percent Range (periods 7, 90, 10, yellow, thickened), Fractal Chaos Bands (lines thickened), and Moving Average (period 45, white, thickened).
The author uses 10-second candles and a 1-minute trading time frame.
The author selects currency pairs using the platform's 'Options and Blitz' feature, which uses a three-scale system to identify low volatility pairs.
The first signal is when the white Moving Average line crosses a green candle.
The second signal is when green candles cross the green line of the Fractal Chaos Bands, confirming the setup.
The Williams Percent Range should be in a buying position above its purple zone (overbought). If the yellow line is not outside the zone, other factors are considered.
If the yellow line does not cross the purple zone but moves downwards, it should not have just arrived from a buying position; it should have maintained its zone for some time. Otherwise, no position is opened.
The author monitors candles for strong trends (large green/red candles) and waits for stabilization before opening a position, provided all three indicators give a signal.
The strategy relies on a confluence of three indicators and specific conditions for entry. The author emphasizes the importance of waiting for all signals to align and monitoring candle behavior for optimal trade execution.
What are the period settings for the Williams Percent Range in this strategy?
7, 90, and 10.
[00:35]
What is the period for the Moving Average in this strategy?
45.
[01:29]
What is the trading time frame used in this strategy?
1 minute.
[01:44]
What is the first signal to prepare to open a position?
The white moving average line crosses the green candle.
[02:26]
What is the second confirmed signal in this strategy?
The green candles cross the green line of the fractal chaos bands.
[02:38]
What condition must the Williams Percent Range be in for a buying position?
It must be above its purple zone, in an overbought position.
[03:38]
What should you do if the Williams %R line is not crossing the purple zone but moving downwards?
Check that it did not just arrive from a buying position and has maintained its zone for some time; otherwise, do not open a position.
[04:43]
What should you do when you see large green or red candles?
Wait for the candles to stabilize before opening a position.
[05:37]
Calculated Indicator Periods
The author emphasizes that the indicator periods are calculated to work well in difficult markets, suggesting a systematic approach.
[00:17]Low Volatility Pair Selection
Using the platform's volatility scale to select pairs is a practical tip for reducing risk.
[02:00]Confluence of Signals
The strategy requires multiple indicators to align, which is a common principle in technical analysis to increase reliability.
[02:26]Williams %R Exception Rule
The rule about the Williams %R line not having just arrived from a buying position adds nuance to the strategy, showing attention to detail.
[04:43]Candle Stabilization
Waiting for candle stabilization before entering a trade is a risk management technique that avoids volatile entries.
[05:37][00:00] Hello everyone. Today I will discuss a very good method which I took from my old method. Change the periods of the indicators with many details and it already gives me a very good results. This
[00:17] method works well even in difficult markets because I calculated the periods of indicators accordingly. And let's start setting the first indicator and it is Williams percent range.
[00:35] let's change periods to 7, 90 and 10.
[00:52] Let's change the color to yellow. thicken the line and save. The second indicator is fractal chaos bands which I don't use very often in various methods but it's a very
[01:07] useful indicator here. Let's just thicken the lines and save. The third indicator is the moving average which I almost use in my methods. The period is 45. Let's keep the color
[01:29] to white. Thicken the line and save. Then I set 10 seconds candles and trading time is 1 minute.
[01:44] Friends, now I want to show you how and where I choose currency pairs. let's click on the open new asset icon then options and blitz. Here you can choose
[02:00] the best currency pairs. This is a very good function and helps me a lot when I'm looking for a low volatility currency pairs. In other words, this platform uses a three scale system
[02:14] to determine the volatility of a currency. So, let me find a good moment and get back to you.
[02:26] I think it's a wonderful moment and the first necessary factor is that the white line of the moving average crosses the green candle as shown on the platform.
[02:38] This is the first signal that I'm preparing to open a position. The second signal is that the green candles must continue to move and cross the green line of the fractal chaos bands.
[02:53] This is also a necessary factor for me to receive a second confirmed signal. That is when the green line of the fractal chaos bands crosses the green candle. And before this happens,
[03:07] the white line of the moving average crosses the green candle. These are very very strong signals. And you see on the platform, everything is going so good. Excellent. Excellent. It's so
[03:22] cool to have the first great win. At this moment, the green candles almost crossed the green line of the fractal chaos bands and the white line of the moving average, at the same time.
[03:38] as I already told you, this is a very good moment. As for the Williams percent range, in this case, it must definitely be in a buying position above its own purple zone that is in an overbought
[03:51] position. but it's worth considering the fact in some cases the yellow line of the Williams percent range may not be outside its purple zone and be close to the upper limit. In this case I
[04:09] also pay attention to other factors and what's going on. Great. I won $2,500 and got back a 1000
[04:26] I think overall I closed the position in profit and that's still great. It's a very good moment and it shows exactly the situation when I said that if the yellow line of
[04:43] the Williams percent range does not cross its own purple zone and simply moves downwards in a selling position then you should pay attention to the fact that these yellow line should not have
[04:56] just arrived in this case from buying position. that is it should not have come down quickly from above and should have maintained the zone where it is for at least some time. If the yellow
[05:13] line of the Williams percent range is not as I explained in this case I don't open the position I think this is one of the main factors and everything is going so so well.
[05:37] great. It's so cool. The position was successfully closed. Friends, I missed the fact that in this method I definitely monitor the candles as well. If you see the candles continue to rise or fall strongly that is large green candles or large red
[05:56] candles are formed. In this case, I wait for the candles to stabilize and then I open the position. If all three indicators give me a signal at the same time, of course. I hope you like today's
[06:08] video and I wish you great and successful trading days. See you in the next video. Thank you so so much




⚡ Saved you 0h 06m reading this? Transcribe any YouTube video for free — no signup needed.