

Как я заработал $400 на плотности
44sКонкретный пример прибыльной сделки с деталями входа и выхода привлекает трейдеров, ищущих рабочие стратегии.
▶ Play Clip"Title promises trading methods and screener setup; video delivers exactly that with examples and settings."
This video demonstrates how to trade using density levels on futures, focusing on strategies like rebound and breakout. The presenter shows real trades, explains how to set up a screener for notifications, and provides tips for identifying profitable formations.
The video covers methods beyond level spike and breakout, including rebound and erosion strategies.
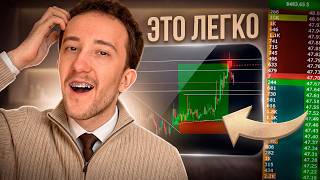
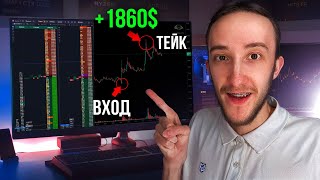
High density on futures triggered a reaction; set limit orders for larger volume, resulted in 1% gain ($400).
Telegram channel provides updates and a chat screener for sharing ideas and asking questions.
Screener sends notifications for high-density coins with hints on trading methods (rebound or breakout).
Hints are based on statistics from past trades, considering density size, dollar amount, coin activity, and number of approaches.
Found density via screener, set limits, earned $800 by closing on a new density after erosion.
Settings include exchange selection, volume filter (up to 2B), formation type (horizontal level confirmed by density), density distance 5%, and erosion time.
High density of $1B with hint for rebound on first approach or breakout after multiple approaches.
Density behind levels suggests rebound; Link density average, hint for gradual rebound or sharp approach.
Create notifications for densities with filters for volume, scattering time, and density life to avoid spam.
Notifications include price, density volume, distance, erosion time, and order type; link to chart for quick access.
The screener 'Gash' helps identify good density formations for profitable trades. Proper settings and notifications enable traders to react quickly to opportunities.
What is the recommended volume filter for the screener in a sideways market?
Up to 2 billion.
05:30
What formation type is selected in the screener for density trading?
Horizontal level confirmed by density.
05:56
What is the default density distance from level set in the screener?
5%.
06:10
What does the hint suggest when a density has two or more approaches?
Consider a breakout by entering the erosion of the density.
02:18
How is the hint algorithm built?
Based on statistics of past transactions, considering density size, dollar amount, coin activity, and number of approaches.
03:02
What is the purpose of setting erosion time in the screener?
To filter out spoofer densities and show only good densities.
07:08
What information is included in a density notification?
Price, density volume, distance, erosion time, lifetime, and order type.
13:31
What is the recommended density life in the glass to avoid spoofer densities?
20 minutes.
06:53
Lum Coin Trade
Demonstrates a successful trade using density rebound with clear entry and exit.
00:16Notification System
Shows how automated alerts help identify trading opportunities in real-time.
02:04Algorithm for Hints
Explains the data-driven approach behind trading hints, adding credibility.
03:02Screener Settings
Provides a step-by-step configuration for finding good density formations.
05:03Notification Details
Highlights the comprehensive data in notifications for informed decision-making.
13:02[00:03] my trades and show how to make money trading from densities and how to set up a screener so that it sends notifications and shows good densities that we have on the market. In previous videos we discussed how to
[00:16] take a level spike and a level breakout from densities. In this video we will analyze all the other methods that this strategy covers. The first trade will be on the lum coin. Here we have a high density on futures and now we
[00:30] touched this density and we had a reaction. After the reaction, I decide to click Stop. I have a fairly short one here. After that, I see that the density is indeed real and set
[00:44] two more limit orders to enter a larger volume, but I was not allowed to do this. As a result, we had a large rollover on which I fixed my position. Before entering the trade, of course, you must initially determine whether the density is good
[00:57] or not. The screener helps us with this. Next, we will analyze the settings that will really help find good densities for the target in this trade where you need to fix the position here. There was already another density which
[01:09] was at a round number of 0.22 and just after we had a throw-off in front of this density, I recorded it because it was also resistance and a rebound could also occur from it. Therefore, in order not to
[01:23] overpower, I close here before it. We also had the same density on the spot, which also restrains the price as a result, from this transaction, we managed to take 1% and earn plus 400 dollars. Here we had good density, a good
[01:37] reaction from it and a good target for how far you could pull the position. I also wanted to remind you that we have a Telegram channel where we post current updates, there is also a chat screener where you can view the current
[01:51] settings, ask a question, point out a bug, communicate and share ideas. If anyone is interested, I will leave all the links in the description under the video. I also wanted to show that we have a very cool function in the screen, this is a notification for densities by
[02:04] densities. Now I received a notification for coin Aa, I go to it and here we see that we have a high density on this coin and all the data on it is also written This density and a hint to it, what
[02:18] we have written here that you can consider the formation for a rebound on the take the momentum with a large number of approaches, two or more. Here we had the first approach, we from the spike by 0.8, about the second approach, we rebound by 0.8, about all
[02:34] make money on this, and now we are approaching the density for the third time and the hint says that in this case you can take a breakout by entering the erosion of this density, it is at 89.5 for us, and now, when it begins to be eroded, you could
[02:49] enter and take this movement and Please note that indeed after the erosion we had a large lang movement, these hints contain a very smart algorithm that adapts to each
[03:02] formation and allows you to determine the correct trading method so that you can really make money from this formation. We compiled the algorithms based on the statistics of our past transactions, that is, we looked at which formations
[03:15] work well, which ones poorly, based on the density data, then how much money is in it Dollars, how big is the density, based on the coin's activity, whether this density is at a level or stands on its own,
[03:29] how many approaches there were to it, we calculate all this, the correct hint with which you can make money, and here we can see this for coin Aa, there was a high density of 900,000 dollars, and the hint said you
[03:43] can consider a rebound on the first approach or a breakout in order to take the momentum with a large number of approaches, two or more. Indeed, we had a rebound of 0.8 pro on the first approach, and there was also a rebound of 0.8 pro on the second approach.
[03:56] Now, when we approached this density for the third time, it was already possible to enter its erosion and take a breakout due to the stops that accumulated behind this density. As a result, after the density erosion, we had a large
[04:09] movement that we could enter and make money from this transaction. Let's analyze the next transaction. I went into the screener, found a good density, threw a beacon. In order to have time to set a stop, then I set limits before this density,
[04:23] they are taken away and a reaction from this density begins, it is visible The fact that this density is high for this coin is that it is being bought off and this means that we have indeed correctly determined the density and a
[04:37] rebound can be expected from it as a result, we are already experiencing a good reaction and this density is starting to move higher and higher and as a result, I decide to close on a new substituted density because after its erosion, it is more
[04:50] likely that the coin will already begin to roll back as a result, indeed, after I exit, the coin reverses from this transaction, I managed to earn plus $ 800. I found this formation using a screenshot and relying on the tips
[05:03] that were written. I made the right decision and earned from this transaction. Let's now move on to the settings with which you can find good formations, click on create a workspace and here in the
[05:16] first tab We select the exchange on which we will trade. I trade Binance Fuge and a volume filter so that we do not get spam from densities on liquid coins such as Bitcoin and Ethereum, which have very large volumes and on which
[05:30] densities of even 1 million 2 million dollars five do not matter will mean that five do not matter will mean that this is not shown to us, we will
[05:43] use a filter to show us coins up to 2 billion. If the market is active, then you can set a value of up to 5 billion, thereby showing us only those coins on which we can really find a good
[05:56] density, then go to the formation tab, here we select the formation, horizontal level confirmed by density, choose any place so that you can trade all strategies from densities, then the distance of the density from the
[06:10] level is 5%, tick the show only formations box, we skip sorting here, go to the graph in the graph, I have the following settings: period 20, this is the distance that is calculated from touch to touch in the level, the number of touches. I
[06:25] set zero here so that all levels are shown to me, and the error between levels is set to one, it is necessary to set it so that the correct values are shown in our tooltips, then the lifetime. I have
[06:37] zero here, trend lines are disabled, densities are set, the following settings are set from $ 400,000, the distance to the density is 5% during the lifetime of the density in the glass is 5 densities, if you still come across spoofer densities, you can set 20
[06:53] minutes here to definitely filter them out. The time for Denmark is zero. But if the volume filter is set to the end here so that all coins are shown, then we can set the erosion time here in the densities,
[07:08] enabled, only really good densities are shown to us. The show only good densities, then we set the erosion time to two,
[07:20] but good densities can even be found with zero erosion time. We also took this into account in the tips, and therefore the tips are based on the density value itself in dollars and also on its erosion time. That
[07:34] is, absolutely every aspect is taken here, covering all formations in a sideways market. I have 2 billion volumes here, so I set zero in the densities here. But if the market moves actively, then I increase the volumes here based on
[07:48] market activity and will also adjust the density based on the coins being shown. Then we move on to In the indicators tab, we put a plus sign and tick the necessary data on the coin that we need,
[08:02] then click save and we are shown a workspace with the formation we need. If you have any questions or you want to add a new function to the screener, be sure to write in the comments, we
[08:15] development, also do not forget to subscribe to the YouTube channel on video. Thank you very much everyone. In this case, we see the Doge coin, we have 1 billion dollars here, we can hover over to see all the data on this density
[08:32] and also a tooltip, and in the tooltip we see that the density for this coin is written here. Large relative to the passing volume, it is not near the level for a long time in the glass, you can consider a rebound on the first approach
[08:44] or a breakout in order to take the momentum with a large number of approaches, two or more, open a large chart and see that we have two levels here and the density is behind them. That is, you can expect an impulse after crossing these levels.
[08:56] We will hit the density and a jump will already occur, that is, this density will imply a spike. data levels and a rebound from the density itself further We have a Bitcoin cash coin here the same thing we have levels and there is a
[09:10] density behind the levels and here it is written that You can also consider a rebound I showed exactly the same information recently in the analysis of transactions When we could work it out and
[09:22] take several movements in a rebound and then in a breakout further formation for the coin Link here We also see the density and when hovering over it you can see a tooltip here the density is already average for this coin and you can consider it in a
[09:36] rebound after a reaction or with a sharp approach after a reaction This means that when we approach the density we will begin to gradually bounce from it in a movement that has already begun to develop and with a sharp approach - this is in the format of a knife
[09:50] when the coin begins to fly out sharply hits the density and also sharply bounces from this density there we simply enter a limit or according to the FA KTU the screener is very good at helping you determine the situation, how it needs to be
[10:05] worked out and how to behave in a position you can also set notifications at the density let's go In the notification tab, click "create" and select a new limit order here. This means that the notification will be based on density. When it
[10:19] appears, we will also receive a notification here. $400,000 is a more optimal option for finding good densities. We can set two scattering times here. If we want to see good densities, we can
[10:32] workspace settings, to show coins up to 5 billion or up to 2 billion based on market activity. We can set the scattering time here to zero
[10:44] so that we are shown only densities based on this setting, which is shown in dollars. But if we cover all the coins, then it is better, of course, to set the scattering time. Because if we set Denmark without the scattering time, then on
[10:57] Ethereum and Bitcoin, such volume coins will already be spam from notifications, because there are $400,000, a million, and $2 million in such volumes, which means nothing, and the scattering time setting will be just right there, which will show what
[11:12] density will actually react. I filter out these coins using the setting and filter by volume, so here I set the scattering time to zero. Here I set either 5 minutes or 10 minutes of density life in the glass, also based
[11:25] on market activity, but to avoid spoofer densities, it's better, of course. Set it to 20 minutes, then there will definitely be real when there are active coins and the
[11:41] cover such densities, I most often set the distance to the density here to 5 minutes. I set the distance to the density here to 5 minutes. I set 23%, also based on market activity. If the market is active, then to keep up with the densities. I set 3% here. If
[11:54] spam from the densities, I set 2%. Then we move on to the filters. Here we have an interval for which we select the trading volume. Here we set 24 hours and select the volume based on market activity. If there is a sideways movement,
[12:10] 2 billion. If the market is active, then you can set up to 5 billion. You can also play with these settings and adjust them to the desired values. Click the checkbox for sound notifications. Telegram notifications. Select the exchange on
[12:22] which we want to receive notifications on densities. Create multiple reminders at once, both for Spot fuge and for the beat, and then we will cover all densities completely. Next, write the density alert title and
[12:37] can also leave a comment. Here we choose to show all coins or show only selected coins that are in your watchlist. I usually choose to show all coins here. You can also
[12:49] exclude coins that we don’t need here. As a rule, only liquid coins can be traded there, as well as illiquid ones. You can also customize this setting here. After that, click save. As a result, we receive a notification
[13:02] that will come to us in the form of a sound signal and also in Telegram. see which densities we have received. Which densities have just arrived. For example, we have a pp link here. T arrived. Let’s see. It says
[13:17] $500,000 at a price of 4.86. Click go and here we have a spread. Please note that we actually substituted the density of 500,000 coins and this density has a hint written on it. What can be done with it. Based on this, you can
[13:31] can be done with it. Based on this, you can already make a decision on how we see this notification for the tiia coin: price, density, volume, density, distance, time, erosion, lifetime, and order type, that is, which direction
[13:47] this density is in. It's all very conveniently configured, so you can even see what's happening on the market from your phone. We received a notification, we looked at all of this, and then we decide whether to trade this
[14:00] formation or not. Here we also have a link to the chart, you can easily go straight to the formation we need. The screener is called Gash. With it, you can find good formations and make money on trading. All
[14:14] the links will be in the description under the video. Well, this video will come to an end. Thank you all very much for watching. Let's shake hands. Let's have fun. Thank you all very much. Goodbye, bye-bye. hands. Let's have fun. Thank you all very much. Goodbye, bye-bye.


⚡ Saved you 0h 14m reading this? Transcribe any YouTube video for free — no signup needed.