
How to Make Money Trading Level Retests
45sImmediately promises a simple money-making strategy, appealing to aspiring traders.
▶ Play Clip"Delivers a practical strategy but includes promotional content and lacks depth on risk management."
This video presents a trading strategy focused on level retests in cryptocurrency markets, primarily using Binance. The presenter explains how to identify active coins using a screener, describes the retest formation, and details four entry methods, including graphical, order book, and breakout approaches.
The video introduces a simple yet profitable trading strategy based on level retests, with a reminder about the Telegram channel for updates and community discussion.
The first criterion is finding active coins. The screener has tabs for top volatility growth and number of transactions. Settings include volume filter from $70M to $100B, correlation filter, and sorting by volatility or growth over 24 hours.
The presenter shares chart settings: 148 candles, horizontal levels enabled, trend levels disabled, and specific density settings. Indicators include coin data and correlation to Bitcoin over an hour.
After configuring tabs, users can view the most active coins and select the top 5-10 for trading.
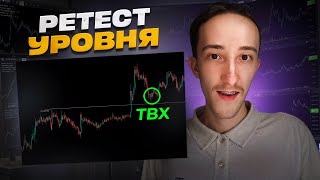
A retest occurs when price approaches a broken level and bounces off it without crossing the structural high or low. The entry point is at the retest.
Place a limit order at the level with a stop loss behind it, targeting the nearest high or low or higher levels.
Wait for the coin to bounce off the retest level, then enter with a stop behind the reaction, targeting the nearest high or low.
Enter based on order book activity: when approaching the level, look for strong buying (green bubbles) in the direction of the trade, then enter as activity slows, with stop behind the retest.
Sometimes a formation appears on retests, leading to a breakout of the local levels (protor gov). Enter on the breakout, with stop loss for the reaction, targeting the intersection of local levels.
The coin may hit the nearest high, form a level, bounce off, and then hit the protor gov, setting up a retest reinforcement. Trade the breakout when price runs into the protor gov.
The strategy involves finding active coins, identifying levels, waiting for breakout and retest, then entering using one of the four methods (graphical, rebound, order book, or breakout).
The coins tab allows filtering by price change, showing popular coins. Example: Reef coin has grown and shows a similar formation.
Even if a retest is missed graphically, monitoring the order book can provide precise entry points, as seen with green candles indicating activity.
The level retest strategy is a versatile approach for trading active cryptocurrencies, offering multiple entry methods to suit different market conditions. Success depends on using the screener to find active coins and combining graphical analysis with order book insights.
What is a retest in trading?
A retest is when price approaches a broken level and bounces off it without crossing the structural high or low.
02:18
What are the four entry methods for retest trading?
Graphical retest, waiting for rebound, order book (glass), and breakout of protor gov.
02:47
What volume filter is recommended for the screener?
Volume filter from $70 million to $100 billion.
00:56
How many candles are used in the chart settings?
148 candles.
01:39
What is the 'protor gov'?
A local level formed on the retest itself, which can be traded as a breakout.
04:08
Definition of Retest
Provides a clear, actionable definition of a retest, which is the core concept of the strategy.
02:18Multiple Entry Methods
Offers flexibility by presenting four distinct entry techniques, catering to different trading styles.
02:47Order Book Entry
Emphasizes the importance of order flow analysis for precise entries, a more advanced concept.
03:43Retest Reinforcement
Describes a nuanced scenario where a retest is reinforced, providing a higher-probability setup.
04:49Order Book Monitoring
Highlights the practical value of monitoring the order book even when graphical signals are missed.
06:28[00:03] how you can make money trading the level retest strategy. This is a fairly easy strategy with which you can make good money. I also wanted to remind you that we have a Telegram channel where we post current updates and posts
[00:17] about what we have added to the screener. What work is currently being done. We also have a Telegram chat in it where you can view the current settings, ask a question, point out a bug, share ideas and discuss various topics. If you are
[00:31] interested, I will leave all the links in the description under the video. Subscribe. The first and most important criterion in general. For any strategy, this is, of course, finding an active coin. The screener helps a lot with this, since here we
[00:43] can set up different tabs, and for searching for active coins, the tabs by top volatility growth and by number of transactions are just right. Let's go to the settings. By the way, we have updated the screener; they now look
[00:56] a little different. Here in the first tab we select the verse. Next, you can leave the formation without filters. Here we now select the filter by volume Here we now select the filter by volume from 70 million to 100 billion so that the
[01:09] filter by correlation filters us, we can leave it by default or customize it for ourselves, then go to sorting and here in sorting we already volatility, the second tab by the number of transactions and the third tab - This is the
[01:25] top by growth, select the time range of 24 hours, the update frequency that is convenient for you, in the chart tab we can copy my settings, the number of candles on the chart is the chart scale. You can customize it in a
[01:39] way convenient for you. I currently have 148 candles by horizontal levels. I use such settings in trend levels, I turn them off, I do not use them, and in densities I have such settings set. Next, in the indicators, I included
[01:52] settings set. Next, in the indicators, I included all the data about the coin and by correlation to Bitcoin, I have it for an hour, then click save and we get such points, we configure them in the same way, the only thing that changes is this type of sorting after
[02:04] we have configured them, we can see the most active coins on the markets, we take the top 5 dash 10 coins in these deposits and we use them for trading with We figured out the search for coins. Now let's move on to the formation itself. The formation for us
[02:18] looks like this: we have an active coin, it creates levels after we cross these levels, we have a breakout and retest. What is a retest anyway? This is when we approach already broken levels and
[02:33] bounce off them beyond the structural high or low, which is already behind this level, that is, we do not cross it. This high or low, in this case, we have according to the picture. This can be considered a structural high or low, and we do not go beyond the
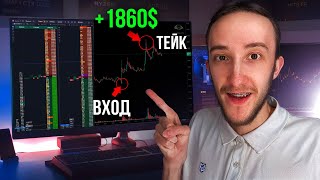
[02:47] level itself, that is, we do not cross this range. The entry point is here in our test. It can be traded in different ways. This is a graphical retest when we simply place our tick at these levels, put a graphical stop behind the
[03:00] which direction our coin is in, and then we pull until the intersection of the nearest high or low, or if we have some levels higher, then we can safely pull to them. The second option from the trader is already happening for us
[03:14] when We are waiting for the rebound itself, that is, when the coin approaches a retest, it is, when the coin approaches a retest, it begins to bounce off it, the retest can say that we are waiting for the rebound itself, making sure that we have already
[03:29] started the action at these levels, we place our stop behind the reaction itself and then we pull until the intersection of the nearest High or Low, and the third option from the trader is already according to the glass when we enter the glass and assume that we have a
[03:43] level here that we are now approaching. And when in the glass, upon approaching this level, good buying or selling begins in the direction we need, in this case, we should have good buying, that is, we should actively have
[03:55] these green bubbles. When these bubbles begin upon approaching, then in the knife format, in the format for slowing down activity, we already enter, we place our stop behind the retest itself and pull the position until the intersection of the nearest High.
[04:08] Also, a formation often appears on the tests themselves when we approach here, we begin to trade here, trade, create about trading. It looks something like this, that we are starting to fall further here. This is how
[04:21] our movement begins to stall and this is the fourth option from the trading system and here we can enter the breakout of the protor gov itself, thereby pulling out a good movement. Here we will already have a Stop Loss for the reaction itself, but the entry point will already be at the
[04:35] intersection of these local levels that formed at the protor gov itself. Then, by the way, it can also happen. Such a scenario is that our coin will hit this nearest High that we had here, which forms a level and after which it will bounce off and
[04:49] hit this protor gov. That is, we can say that the protor gov is already set for a retest, that is, we already have a retest reinforcement. Here we already take the movement in the format of a breakout when we run into this protor gov and thereby
[05:03] pull out also quite good deals, by the way. Write in the comments. Would you be interested in seeing an analysis of the structure breakout strategy, how to trade it? What settings to use for entry points, stop take according to the retest itself, we
[05:17] have analyzed Formations We have active coins, from which we look for such formations. When our coin breaks through the levels, it returns to them again and already in the retest zone, we look for the formation either by the order book
[05:32] or a graphical formation, or we wait for the trade and then we can work out the deal, thereby earning money. You can also search for active coins in the coins tab. Here we have a list of coins and we can filter them. Click on the
[05:45] column name and we filter and here we see the most popular coins that we have on the market now. We sort by price change at the top. We have the reef coin, it has grown quite well and you can
[05:58] look for a similar formation on it. We have levels here, we can mark them like this. And by the way, we have the same formation emerging that I just showed. We have good levels, we can wait for their breakout,
[06:11] after which the coin will roll back to the retest and here we will wait for the formation itself and enter the deal, thereby taking away the good movement that was drawn out by the
[06:28] We just missed the retest by a hair. This also needs to be taken into account, and when we miss it by a hair, then it needs to be looked at in the glass, so it's important to monitor not only graphically, but also to take into account the glass formation
[06:41] because it allows you to work out the deal more precisely. Here, the coin could have started to fall, and here, in these green candles, there was already good activity. Long bubbles, or, for example, they would have substituted density, this
[06:54] meant that everything was already at this point, we would have a reversal movement, we entered, set a stop, and then dragged the deal to the high. Well, this video will come to an end. Thank you all very much for watching, shake hands, have fun, have fun, everyone,
[07:08] pull the calf. Thank you very much everyone. Goodbye, bye bam [music]



⚡ Saved you 0h 07m reading this? Transcribe any YouTube video for free — no signup needed.