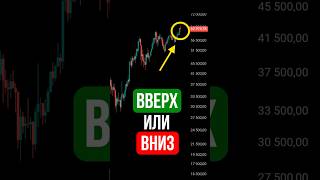

Can You Predict This Price Move?
35sInteractive challenge engages viewers to test their skills, boosting comments and watch time.
▶ Play Clip"The title promises an interactive exercise and delivers exactly that, but the real value is thin — it's a quick tip rather than a deep training session."
The video presents a technical analysis exercise where viewers are asked to predict the direction of an asset's price based on a chart pattern. The instructor identifies a rising wedge and a terminal diagonal, signaling a potential trend reversal to the downside, and then confirms the forecast with the subsequent price action.
Viewers are invited to test their analytical skills by predicting price direction from a raw chart with no hints. The choices are up or down.
The chart shows a clear uptrend that ends with a gradually narrowing range consisting of five waves.
The structure is identified as a rising wedge from a technical analysis perspective, indicating a trend reversal, and as a terminal diagonal from a wave principle perspective, indicating the completion of the structure.
Since the pattern is visually formed and the price has reached the resistance trendline, a downward trend reversal is expected with a higher probability.
The video ends with the price confirming the forecast. The instructor encourages viewers to subscribe to learn and develop their market intuition.
Dual Perspective on Patterns
Shows how the same structure can be interpreted as a rising wedge or a terminal diagonal, tightening the analytical framework.
00:35Trend Reversal Probability
Explains a clear, actionable rule: when the price touches the resistance trendline, the likelihood of reversal increases.
00:49Price Action Confirmation
Confirms the forecast, reinforcing the reliability of the analyzed patterns.
01:05[00:00] Куда пойдет цена с большей вероятностью? Проверим твои навыки анализа. Никаких подсказок, только голый график. Найди паттерны и определи, куда пойдет цена. Вверх или вниз.
[00:18] Анализируем вместе. Первое, что бросается в глаза, это восходящий тренд. На конце восходящего тренда формируется постепенно сужающийся диапазон, состоящий из пяти волн.
[00:35] С точки зрения технического анализа эта фигура восходящий клин, который указывает на смену тренда, а с точки зрения волнового принципа эта структура конечная диагональ, которая указывает на завершение структуры.
[00:49] Поскольку фигура уже визуально сформирована и цена достигла трендовой линии сопротивления в данном месте, то мы с большей вероятностью ожидаем смену тренда на нисходящий.
[01:05] Давайте посмотрим, что в дальнейшем произошло с ценой. Подпишись, чтобы обучаться и развивать насмотренность. Рынок легче, чем кажется.
⚡ Saved you 0h 01m reading this? Transcribe any YouTube video for free — no signup needed.