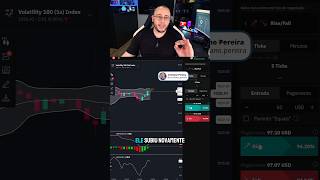

My First Manual Trade Setup on Deriv 2026
44sViewers are curious about real trading strategies and the initial setup, making it highly educational for aspiring traders.
▶ Play Clip"Delivers exactly what the title promises — a real walkthrough of first manual Deriv operations — though the '2026' framing is just a timestamp gimmick."
In this video, trader Cristiano Pereira demonstrates live manual trading operations on the Deriv brokerage platform, using a combination of technical indicators — Bollinger Bands, MACD, RSI, and support/resistance levels — to execute rapid entries on a 1-second timeframe. He walks through several quick trades, including a loss and a recovery, and closes the session with a net profit of $138.40 (R$747.36).
The trader uses Bollinger Bands, MACD, RSI, and support/resistance levels as his main indicators. Support and resistance zones are used to identify entry points.
Beginners should draw support/resistance lines but not take them for granted. The correct approach is to identify the zone, wait for confirmation, and only then proceed with the entry.
The first entry on the volatile asset results in a win of 47.10, demonstrating the strategy's initial success.
After a touch of the upper Bollinger Band, the trader makes another entry betting on price appreciation, targeting the upper band again.
A $50 loss is recorded. The trader subtracts it from his running total, bringing the balance down to 44.20, and continues observing the asset.
To recover the lost $50, the trader makes a $100 entry, again targeting the upper Bollinger Band, which results in another win (94.20).
The strategy involves looking for the upper Bollinger Band at the 100 volatility mark on a 1-second timeframe. A MACD crossover toward the signal line supports betting on price appreciation.
The session ends with a profit of $138.40, equivalent to R$747.36, after a series of quick entries and one recovery trade.
The video demonstrates a practical, indicator-driven scalping strategy on Deriv's 1-second charts, where quick entries targeting the upper Bollinger Band, confirmed by MACD crossovers, can yield consistent small wins. The key takeaway for viewers is the importance of waiting for confirmation before entering a trade.
Which four indicators does the trader use in his Deriv strategy?
Bollinger Bands, MACD, RSI, and support/resistance levels.
00:02
What advice is given to beginners about support/resistance lines?
Draw the lines but don't take them for granted — identify the zone, wait for confirmation, then enter.
00:14
What timeframe and volatility setting were used for the trades?
A 1-second timeframe with 100 volatility.
02:03
What was the final net profit of the session in dollars and reais?
$138.40, equivalent to R$747.36.
02:31
How did the trader recover his $50 loss?
He made a $100 entry targeting the upper Bollinger Band, which resulted in a win of 94.20.
01:33
What does a MACD crossover toward the signal line indicate in this strategy?
It signals that the trader can bet on price appreciation toward the upper Bollinger Band.
02:03
Confirmation Before Entry
A core risk-management principle: never trust indicator lines blindly — always wait for confirmation before entering a trade.
00:14Loss Recovery Technique
Demonstrates a practical martingale-style approach — doubling the entry size to recover a previous loss.
01:331-Second Scalping Strategy
Reveals a concrete, repeatable setup: upper Bollinger Band entries on a 1-second chart with MACD crossover confirmation.
02:03Session Profit of $138.40
Quantifies the outcome of the strategy, showing a tangible result of $138.40 (R$747.36) from a short scalping session.
02:31[00:00] Virada de ano e vamos às minhas primeiras operações manuais aqui na corretora Derive. Já estou com os principais indicadores da minha estratégia que são bandas de Bollinger, MACD, RSI e também suporte e resistência.
[00:14] Nesse último, claro, eu identifico as zonas de suporte e resistência e também faço as minhas entradas. Para quem está começando, para quem está iniciando, sempre é interessante desenhar as linhas, mas não levá-las como toque simples.
[00:28] Você identifica a zona, espera a confirmação para depois fazer a sua entrada. Vamos lá, estou aqui na volatilidade 100 de um segundo. Vou fazer uma entradinha em Rise, focando aí a valorização desse ativo.
[00:42] Primeira entrada, primeira win. Vamos ver aqui, 47.10. Vamos colocar na minha calculadora aqui, 47,1. Só peguei aqui a básica valorização buscando a banda de Bollinger superior.
[00:57] como houve um toque aqui. Vou fazer mais uma entradinha na valorização. Vamos ver aí. Buscando a banda superior, tá, gente? Aproveitando aí, mais uma entrada, mais 47,10. Vamos lá, 47,10.
[01:11] 94,2. Mercado ali se movimentando ainda próximo da minha última entrada. Mais uma entrada em valorização. Estou fazendo aqui entradas r por causa do v t gente Tomei um loss agora de 50 d tiro esse 50 da minha calculadora volto para 44 Observo o ativo ele subiu novamente
[01:33] Vamos fazer agora uma entradinha de 100 para recuperar esses últimos 50 que eu perdi. Novamente, estou buscando a banda de Bollinger superior. Peguei mais uma win. Vejo aqui no reports 94,20.
[01:48] 94,20. já tenho aí 138 dólares. Gente, o que eu fiz aqui de operação? Busquei simplesmente a banda de Bollinger superior na volatilidade 100 de um segundo.
[02:02] Vocês podem ver aqui, o MACD se afastou bastante da minha linha sinal, houve uma alta íngreme em direção dessa linha vermelha e quando há um cruzamento dessa linha é mais uma coincidência
[02:14] nos meus sinais, indicando que eu posso também apostar na valorização. Então eu tinha aqui o indicador do MACD fazendo o cruzamento e ele buscando aí a banda superior, como ele fez nessa última movimentação recente, beleza?
[02:29] Então é isso, 138,40. Isso daqui em dólares, 138,40, 747,36 reais. Já segue aí para ver mais Day Trade Online explicado.
[02:41] Daqui a pouco eu já volto a fazer os vídeos no YouTube com vídeos mais explicados ainda, com mais detalhes, beleza? Então é isso, segue aí o Cristiano.Pereira.




⚡ Saved you 0h 02m reading this? Transcribe any YouTube video for free — no signup needed.