
Bollinger Setup: 90% Win Rate?
60sThe promise of a high win rate (90%) immediately grabs attention and sparks curiosity.
▶ Play Clip"The title promises a trading setup and the video delivers exactly that—a clear, actionable strategy with backtested results. No fluff, just substance."
This video presents a trading strategy for the 15-minute chart based on the first candle of the day and Bollinger Bands. The strategy generates buy and sell signals based on the first candle's position relative to the bands, with a defined target and stop-loss. The presenter shows backtest results and demonstrates how to adjust parameters to achieve different win rates.
Configure Bollinger Bands with deviation 1, period 10, and exponential type.
The first candle of the day must be positive and its entire body must be completely below the lower Bollinger Band.
The first candle of the day must be negative and its entire body must be completely above the upper Bollinger Band.
Place a buy order at the high of the first candle (or sell at the low) and execute on the next candle.
Default target is 170 points and stop-loss is 400 points, yielding an 83% win rate.
Reducing the target to 50 points increases the win rate to 96%, while a 30-point target pushes it to 99%.
The strategy performs best in a scalping context, with smaller targets and wider stops producing a smoother equity curve.
What are the exact settings for the Bollinger Bands indicator in this strategy?
Set the Bollinger Bands indicator with deviation 1, period 10, and exponential type.
00:35
What are the two conditions for a buy signal in this strategy?
The first candle of the day must be positive (green) and its entire body must be completely below the lower Bollinger Band.
01:56
What are the two conditions for a sell signal in this strategy?
The first candle of the day must be negative (red) and its entire body must be completely above the upper Bollinger Band.
07:46
Where is the entry order placed and when is it executed?
Place a buy order at the high of the first candle (or sell order at the low) and execute it on the next candle.
03:54
What are the default target and stop-loss values used in the backtest?
The default target is 170 points and the stop-loss is 400 points.
03:54
What is the win rate with the default target and stop-loss?
With a 170-point target and 400-point stop, the win rate is 83%.
09:17
How does reducing the target to 50 points affect the win rate?
Reducing the target to 50 points with a 400-point stop increases the win rate to 96%.
10:02
In what trading context does the strategy perform best according to the video?
The strategy performs best in a scalping context, with smaller targets and wider stops producing a smoother equity curve.
11:18
Buy Signal Conditions
Defines a clear, objective entry rule based on the first candle's position relative to the Bollinger Band.
01:56Sell Signal Conditions
Mirrors the buy logic, providing a symmetrical approach for shorting.
07:46Backtest Statistics
Provides concrete performance metrics (83% win rate, profit factor 2.18) that validate the strategy's potential.
09:17Scalping Preference
Reveals that the strategy's equity curve is smoother with smaller targets, indicating a scalping bias.
11:18[00:20] share with you a setup for the 15-minute mini-index chart. To implement this strategy, we will use Bollinger Bands. The Bollinger Bands indicator. It's a very common indicator that you'll find in your
[00:34] Profit Chart, and you should configure it as follows. Let's set the as follows. Let's set the deviation to 1, the period to 10, and the exponential type. So you place the Bollinger Bands indicator on your chart, double-
[00:49] click on it, and configure it with a deviation of one, a period of 10, and an exponential type. It will then place these two lines on the chart,
[01:02] these two lines on the chart, forming the Bollinger Bands. In this strategy, we will work on the 15-minute chart using the first candle of the day as a base. And it's a really cool strategy that gave
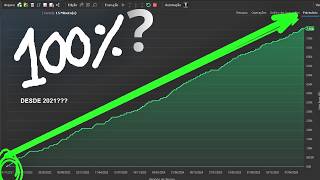
[01:15] us a very upward capital curve over time. We've been doing a backtest here since 2019, and you have a very upward-sloping capital curve, with excellent statistics for this strategy. We can configure the
[01:29] target in such a way as to produce a hit rate of around 90%, or even more than that. I'm going to show you here how we're going to implement this strategy, okay? We will work on buying and selling. And I've
[01:43] picked an example of a purchase here to show you how the strategy works. The buy signal will occur as follows. We need the first candle of the day to be a positive candle. That's the
[01:56] first condition for purchase. The first candle of the day on the 15-minute chart needs to be a positive candle. Once you have that first condition happening, you'll need to do another analysis, which is as follows: in addition to the
[02:12] first candle of the day being a positive candle, we need that candle positive candle, we need that candle to be below, completely below the lower Bollinger Band line, totally below.
[02:27] Its high and low, and the entire body of the candle—the whole candle—must be completely below the lower B line. It cannot even be touching that line. What we want here is a candle that opened
[02:43] completely below the lower B line. Its high, low, open, close, everything, everything has to be below the lower B line. It has to be the lower B line. It has to be a candle that's completely below, right?
[02:57] Now, here's the thing: there's no definition of distance, okay? I didn't specify a distance, okay? I didn't specify a distance definition. All I need is for the candle to be a positive candle that is completely below the
[03:10] bottom line of the bonger. Even if it were nearby, if it were completely below, we would already have the purchase conditions look, in the case of a purchase, right? You only need to look at the maximum, okay? Because if the
[03:24] high is below the lower line of the Bigger, logically the entire candle will be below, right? Once you have those conditions in place, we're going to do the following here. Let's take a buy order and place it at the high of
[03:39] this order is triggered, it must be triggered immediately on the next candle. We will set a target of 170 points and a stop of 400 points, and we can make modifications to this ratio. We can modify the target,
[03:55] we can also modify the stop, but the statistics I'm presenting to you here at this initial stage are using these values: a target of using these values: a target of 170 points, a stop of 400 points, and we
[04:09] produced with an 83% success rate. Right? Here are the operations. For example, if we enter with 10 contracts, we'll have these
[04:23] we'll have these target values and these stop-loss values. And we can make further modifications later so that we can see the different targets and stops that can be placed in this strategy.
[04:35] Immediately on the next candle, I need the order to be executed, because if it's not executed on the next candle, then there's no trade. Then you realize that's exactly what happened. He got involved in the
[04:48] buying operation, right? It broke the high here, executed the buy order, went there and hit our target of 170 points. After he had that operation, there are no more operations scheduled for that day. This setup will only work with the
[05:01] first candle of the day. And let's look at another buying scenario here so we can understand the strategy. Let's take a look here. Grab this one so
[05:14] Let's take a look here. Grab this one so we can take a look. Look, we had a similar example here too. Here's the first candle of the day; you Here's the first candle of the day; you 'll see it was a positive candle, and
[05:26] its high was below the lower Bing line. What did we do? We placed a buy order at the high with a stop loss of 400 points and a target of high with a stop loss of 400 points and a target of 170 points, and the target was reached.
[05:41] Let's take another situation here. Here, take this, so we can see it too. Same thing here, look. It's very similar too. Here it is. First of the day. Positive. Maximum below the lower
[05:54] Boliger line. Entry into the buy zone, target achieved. Let's take another situation here so we can look at it. Let's take a look here. Oh, another situation Let's take a look here. Oh, another situation here. Here it is. First candle of the
[06:06] day on the 15-minute chart. It was positive. First condition satisfied. The second condition is this: we need this candle to be completely need this candle to be completely below the lower Boling line,
[06:21] meaning its high cannot even touch the lower Bing line. He has to be completely subdued. And that's what happened, that's what we got here. So, once we have confirmation of that, once
[06:34] that candle closes, we're going to take a buy order and place it at the high with a target of 170 points, a stop at 400 points, and then we've hit the target . You have several examples here
[06:49] of entries like that. Let's grab another one here. Same thing here, look. See? Same thing here. See here too. Same thing happening here, look. Target hit. Same thing happening here, look.
[07:05] Here too. Same thing, look. See? And you realize that here he was very close. Here, the high of the first candle of the day was very close to the lower line. But he met the condition because he didn't touch the bottom line.
[07:18] The first candle of the day did not touch the lower line, satisfying the with a target of 170 points. The target was hit. But this strategy will also operate in sales, not just in purchases.
[07:32] In the sale, it will be the opposite. It will be the reverse of the purchase. Look, let's take a sales scenario here so you can understand. In a sale, I want the first candle of the day to be a negative candle.
[07:46] It has to be negative. And I need his minimum reading to be completely his minimum reading to be completely above the upper Bollinger Band line, right? It has to be a negative candle that doesn't touch the upper
[08:01] Bolgerian thread. He has to be above the upper Bger line. It's a candle that's upper Bger line. It's a candle that's above Bing, right? So, once you have confirmation of these conditions, you have to wait for the
[08:14] candle to close. We can't do analysis with an open candle, right? So, we wait for the candle to close, and once it closes, satisfying these two conditions, we place a sell order here , we'll put it at the low,
[08:27] , we'll put it at the low, and there you have it, entry with a target of 170 points, stop at 400 points. Here's another sales situation. Just look. Here's another sell situation, the first candle of the day on the 15-minute chart.
[08:40] It was a negative candle and its low was above the upper Bing line. So we had a negative candle completely above the bowing point. The entry point was placed at the low, it was hit
[08:55] was placed at the low, it was hit here, and the trade resulted in a profit. We're working here with a target of 170 points and a stop loss of 400 points. Now let's study the statistics to see how this
[09:08] setup has performed over time. Working with a target of 170 points and a stop loss of 400 points, these were the statistics . We had 141 . We had 141 trades with an 83% success rate,
[09:22] profit factors of 2.18, and a payoff of 0.43 with a drawdown of 10%. The capital curve was this one here. And then you have this list of operations. Take a look at the strategy's operations, working with a
[09:37] strategy's operations, working with a target of 170 points and a stop loss of 400 points. It is possible to make modifications. I'm going to show you this now. We can modify the target size and the stop size. Let's suppose we
[09:52] stop size. Let's suppose we want to have a higher success rate. So we can reduce [the risk] by, for example, setting a target of 50 points at the 400-point stop loss. Let's take a look here. When
[10:04] I set a target of 50 points and a stop loss of 400 points, you have this capital curve, and then you achieve a much higher success rate . In this case, we have a 96% accuracy rate. So you can achieve a
[10:19] So you can achieve a much higher success rate, almost reaching 100% accuracy, which is currently at 96%, but you can work in other ways as you can work in other ways as well. For example, let's set a
[10:32] target of 250 points here to see how it looks, right? Let's take a look here. Target of 250 points. Let's see here. You can see that the success rate was 68%.
[10:45] success rate was 68%. 140,141 operations with a payoff of 0.63, right? We can modify it, so let's put it here, let's set the target to 350 points put it here, let's set the target to 350 points , and the stop loss to 350 points. Let's see
[11:01] how this goes. Look, we have how this goes. Look, we have 141 trades with a 58% success rate and a payoff of one, because here we have a one-to-one ratio. And you have this
[11:14] capital curve here, look. It has this capital curve. This setup here makes it more interesting. It becomes more interesting with a better capital curve when we lean more towards scalping, right? When we
[11:28] focus more on scalping strategies, it tends to result in a better capital curve and better statistics. Look, I've set a target of 100 points here, and a stop loss of 350 points. So here you have an 87% success rate,
[11:44] 141 trades, and this capital curve here. And we can modify that too, right? Let's make some changes here so we can see. Oh, 400- point stop loss. Let's set the target here to 400 points.
[11:59] Let's see about that. 400 and 400. Oh, we're here with 141 trades, 56% accuracy, one to one as well. And then you have this capital curve here. Things are n't looking very good anymore, are they? You
[12:14] can clearly see here that this setup works best in a scalping scenario. It's better to put him to work on the scalp, right? Just look. Let's shorten this section. I'm going to put 30 points here, right? Very short. It's actually a pretty short target,
[12:31] but just so we can see how it looks there, look. Okay ? Just so we can see how it turns out. Look, the capital curve ended up like this , right? The capital curve has been rising sharply , with this single stop-loss here. So, the success rate was 99%.
[12:46] It had a 99% success rate. That's a pretty high success rate, isn't it? Working here with a stop loss of 400 points and a target of 30 points. Logically, the target is quite short here, right? It's right next to the entrance, but anyway, it's
[13:01] entrance, but anyway, it's showing a 99% accuracy rate here. So here are the operations, okay? All the operations are here. So you can make several adjustments to the stop target there. In any case, we've
[13:14] noticed here that it's an interesting setup, one that has yielded good on a 15-minute chart, day trading, using the this video, just click the
[13:28] like button and we'll see you in the next one. Receive the channel's various strategies. There are dozens of open-source codes that you can use freely in your profit chart. Enroll today and receive, in addition to various setups,
[13:42] step how to create strategies in the Profit Chart editor. And best of all, when you enroll, you get access to our support group, where we share various codes and create several strategies based on
[13:57] program a setup and [music] but don't know how? Through our support service, we create the code for you. Enroll today and get access to all of this right away. We share the setups with 100% open source code. You
[14:13] can request an unlimited number of codes throughout the two months of support. You will learn from scratch how to set up various [music] trading systems and obtain statistics to discover
[14:26] winning strategies. A training program designed to teach traders to be more than just ordinary investors [music], but developers of new strategies developers of new strategies for the stock market.

⚡ Saved you 0h 14m reading this? Transcribe any YouTube video for free — no signup needed.