

Bollinger Band Entry Rule Explained
44sThe simplicity of the entry rule makes it easy for viewers to understand and potentially replicate.
▶ Play Clip"The title accurately reflects the content: 11,000 trades and 100% win streaks are shown, though the strategy is not a guaranteed system."
This video presents a trading strategy for the 5-minute mini-index (WIN) and mini-dollar (WDO) futures markets, based on Bollinger Bands and time-based entry rules. The strategy is designed to profit from consolidation periods, with backtest results showing high win rates and consistent equity curves.
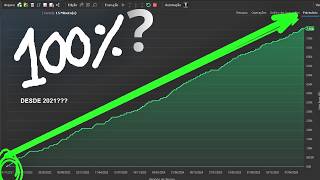
A backtest on the mini-index generated 11,000 trades with excellent statistics, and the strategy also worked on the mini-dollar with 3,000 trades.
Configure Bollinger Bands with deviation 1, period 5, arithmetic type. This generates buy and sell signals on the chart.
The robot operates from 1 PM to 6 PM, capturing consolidation movements in the 5-minute timeframe.
Enter a buy position when a candle closes below the lower Bollinger Band after 1 PM. Enter at the opening of the next candle.
Default target is 50 points, stop loss is 300 points. The robot may also use the opposite Bollinger Band as a dynamic target.
Enter a sell position when a candle closes above the upper Bollinger Band after 1 PM. Enter at the opening of the next candle.
For mini-dollar, use target of 3 points and stop loss of 8 points (or modified). Same entry rules apply.
From Dec 2023: 11,075 trades, profit factor 1.18, hit rate 80%, payoff 0.27, drawdown 7.12%.
Reducing target to 30 points increases hit rate to 87% and steepens the equity curve.
10,000 trades, profit factor 1.24, 71% accuracy, payoff 0.41, drawdown 5.79%.
The robot compares the fixed target with the opposite Bollinger Band and uses the closer one as the exit.
This consolidation-based strategy using Bollinger Bands and time filters shows strong backtest performance on both WIN and WDO. Traders can adjust targets and stops to suit their risk preference.
What are the Bollinger Bands settings used in this strategy?
Deviation 1, period 5, arithmetic type.
00:50
What is the trading time window for the robot?
From 1 PM to 6 PM.
01:14
What is the entry condition for a buy trade?
A candle closes below the lower Bollinger Band after 1 PM; enter at the opening of the next candle.
02:08
What are the default target and stop loss for WIN?
Target 50 points, stop loss 300 points.
02:56
What is the entry condition for a sell trade?
A candle closes above the upper Bollinger Band after 1 PM; enter at the opening of the next candle.
03:50
What are the default target and stop loss for WDO?
Target 3 points, stop loss 8 points.
05:32
What was the hit rate for the WIN backtest with default settings?
80%.
07:42
What was the profit factor for the WIN backtest?
1.18.
07:42
What was the drawdown for the WIN backtest?
7.12%.
07:42
How does the robot decide between the fixed target and the opposite Bollinger Band for exit?
It uses whichever is closer.
10:14
11,000 Trades Backtest
Demonstrates the strategy's robustness with a large sample size.
00:02Time-Based Filter
Limiting trading to 1 PM-6 PM focuses on consolidation periods, a key insight.
01:1480% Hit Rate
High win rate indicates the strategy's effectiveness in consolidation markets.
07:42Adjusting Target Improves Hit Rate
Reducing target to 30 points increased hit rate to 87%, showing optimization potential.
08:28Dynamic Target Mechanism
Using the opposite Bollinger Band as a trailing target adds flexibility.
10:14[00:02] 5-minute chart of the mini-index and the result was impressive. We had an , doing a long backtest. To give you an idea, this backtest here generated 11,000 trades and the statistics were excellent. Here
[00:16] interesting is that this strategy worked not only on the mini-index, but also on the mini-dollar. Look , if we put W here, you this also worked very well in the 5-minute mini-dollar market. Look, there were 3,000
[00:31] transactions and the resulting capital curve is this one here, in the corner of the screen. See? A very interesting curve. In this video, I'm going to share with you this strategy for the 5-minute chart of the mini-index and mini-dollar futures.
[00:50] you'll be able to easily find it in your indicators tab on Profit Chart. I configured it as follows: deviation one, period C,
[01:02] arithmetic type. See here? Deviation one, period C, arithmetic type. Then, when you execute the sentence, you'll see the Bollinger Bands indicator and
[01:14] buy and sell signals on the chart. As you can see here, the operations of this strategy will be buy and sell operations carried out at a specific time. As you can see here, I set the robot to start at 1
[01:29] PM. He starts making buy and sell transactions at 1 PM, you see here? And he will only stop making buy and sell transactions at 6 PM. It will capture that entire period of the chart in the 5-
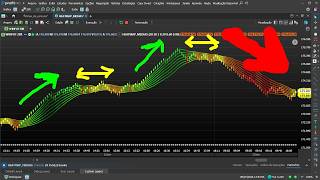
[01:43] minute timeframe, precisely because it's a robot that seeks to trade in consolidation. This robot will have a significant advantage when the market is consolidated, making erratic movements. It adapts very well to this scenario,
[01:56] producing the capital curve you're seeing here over a good you're seeing here over a good testing period.
[02:08] simple. We will enter the buying position starting at 1 PM, the moment a candle closes below the lower Bing line. Here's the candle here, which was the 1 plus 5 candle, closed below the lower
[02:26] Bing line. At the moment this happens, this setup will enter the market operation; at the opening of the next candle, it needs to wait for the closing of that candle. When this candle closes and confirms that the
[02:40] close was below the lower Bolling's line, it will immediately enter next candle. As you can see here, he made a very quick exit. See here? The departure was very quick. Why? I set up this system to use the
[02:56] following target and stop parameters. Look here. I'm using a target Look here. I'm using a target of 50 points and a stop loss of 300 points. This can be changed, okay? Here, in the input, it's a parameter. And there's an
[03:08] important detail here that I'm also using. And there's an important detail here. I can exit the trade not only at the 50- point target, because if the market continues to fall, if the market
[03:21] continues to fall and that upper line goes below the 50-point target, I can use the upper Bollinger Band to exit. In other words, I can take that 50-point target and move it down following the upper line
[03:37] move it down following the upper line of the Big until the price reaches that upper line or hits the stop. In the sale, it will be the opposite. Look here. See? It's already possible to sell here. Starting at 1 p.m., every time the price closes
[03:50] at 1 p.m., every time the price closes above the top bowing line—here, the top line—it means a sale. And he's already getting involved in the sale, you see? He went into the sale. The goal of this strategy is consolidation, to capture a market that is already
[04:02] consolidating. Since she has a short target, she'll do very well doing this, especially operating during that afternoon period. You can see that this white candle here closed above the
[04:15] that, it entered a sell position at the opening of the next candle. He enters the sell position with a stop-loss of 300 points. The stop loss needs to be set a little further away to give the price room to move, because since it's a consolidation setup, if the stop loss is
[04:31] too short, the market will end up triggering the stop loss when it's already consolidating. So it's good to have the stop loss a little further away. That's why I set a stop loss of 300 points and a target of 50 points.
[04:46] As you can see here, the target of 50 points was reached in this situation. I'm going to take another situation here, look. Oh, things are getting better here, right? Very fast. This candle here closed below the lower
[04:59] BL line. The moment we have confirmation of the closing of this position, the trader enters a buy order at the opening of the next candle with a target of 50 points and a stop loss of 300 points. You can see that he 's capturing a pure
[05:12] price consolidation movement here. Look here. Here you have negative candle, positive candle, cendo, positive candle, positive, negative, negative, positive. There's a lot of confusion about the price, and the robot is doing well in that confusion.
[05:32] minute chart, the robot will work the same way, but with a difference in target and stop-loss. In the case of the mini-dollar, I will use a target of three points and a stop of modified, and we will obtain different statistics by doing so.
[05:46] But here I've set these values for target and stop. He will enter a sell position when the candle closes above the upper Bollinger Band and he will enter a buy position when the candle closes below the lower Bollinger Band. And
[06:00] in this case, the candle closed above the upper Bollinger Band line. He enters the sell position with an eight-point stop loss and a three-point target. Just look. Let's take a look here . The target was hit. Here again you had this candle. This candle
[06:15] closed below the lower line. So that was a buy signal. At the opening of the next candle, he enters a buy position with a target of three points and a stop loss of eight points. See? Let's look here again. Oh, another buying situation.
[06:30] This candle here closed below the lower Bollinger Band line. He will enter a buy position at the opening of the next candle with a target of three points and a stop loss of eight points. Here, look, a sales situation. The candle closed above the
[06:45] upper Bollinger Band line. He will enter the sell position at the opening of the candle. Next, with an eight-point stop loss and a three- point target. The target was hit here, you see? And by doing that, he obtained this capital curve here. This is for the mini-
[07:00] capital curve here. This is for the mini- dollar, 5-minute chart. look at the statistics for this strategy. In this case, I'm going to start
[07:12] 5-minute chart of the futures index, as I explained to you here, right? We 're using these numbers here: a target of 50 points, a stop of 300 points, a deviation of one, a period of five, an arithmetic type, working within a timeframe that
[07:28] goes from 1 PM to 6 PM. In the mini-index, the statistics generated were these: That's in backtesting. We had these statistics here, since December 2023, we had these
[07:42] statistics here, a total of 11,075. 1075 entries that generated for us a profit factor of 1.18, a hit rate of 80%, a payoff of 0.27 and a drawdown of 7.12.
[08:00] and a drawdown of 7.12. Here you have the cataloged operations, as you can see, they are great sequences of hits. As you can see, these are very good sequences. This setup will often
[08:15] achieve 100% accuracy streaks a very good hit rate. And I can even make other
[08:28] modifications, for example, I can shorten the target, put a 30- point target, for example. It will become even easier for the strategy to successfully exit at a profit within consolidation movements. As you
[08:40] can see, the capital curve has become quite steep, and the success rate has likely increased even further. Let's see. It has an 87% success rate. Several times this will seem like we're 100% sure, right? At the moment the
[08:53] he will achieve sequences with a 100% success rate. Very interesting. It's a consolidation setup, right, for a consolidated market. In the mini-dollar market, this setup
[09:06] interesting way. Look at the capital curve formed here. We're getting a good backtesting period here, look. These extremely upward-sloping capital curve . We had a total
[09:19] of 10,000 operations here, profit factors of 1.24, 71% accuracy, POF of 0.41, and of 1.24, 71% accuracy, POF of 0.41, and Drodal of 5.79%.
[09:32] And these operations here, look, these were, as you can see, very interesting operations. And we can make modifications too, right? For example, we could put a five-point target there. We're raising the
[09:45] bar. Let's see how it goes. With a target of five points, the statistics also become very interesting. We have these statistics here, this is with a five-point target. The success rate is falling, but the capital curve remains steeply
[09:59] upward and the results are very interesting. With a target of eight points and a stop loss of eight points. Let's see how this looks in the mini-dollar market, 5- minute chart. The statistics are quite interesting as well. See what's on the
[10:14] mini-dollar here? Look, with an eight- point target and an eight-point stop loss, the statistics remain excellent. Remember that when I set a target of eight points, it doesn't necessarily mean it's always hitting that eight-point target,
[10:28] because often it uses the opposite band. For example, in the case of a buy, he enters when the candle closes below the
[10:40] lower line and sets a target of eight points. But if he realizes that the top line is in a better position, instead of using the eight- point target, he'll use the top line as the target, you understand? So he's
[10:54] going to do that calculation, he's going to see who 's in a better position, whether it's the eight-point target or the top line. That's in the case of a purchase. In the case of a to perform this calculation. He's going to enter the sell position and he's going to position either the
[11:11] eight-point target or the target based on the lower line, calculating which one is closer, okay? So he has this variation when positioning the target. If you enjoyed this video, just click the
[11:24] like button, subscribe to the channel, and turn on notifications so you're always up to date whenever we bring you new strategies here on the channel. Receive the channel's various strategies . There are dozens of open-source codes
[11:37] that you can use freely in your profit chart. Enroll today and receive, in addition to various setups, complete training teaching you step-by- step how to create strategies in the Profit Chart [music] editor. And
[11:50] best of all, when you enroll, you get access to our support group, where we share various codes and create several strategies based on your feedback. Do you need to program a music setup and don't know
[12:03] how? Through our support service, we create the code for you. Enroll today and get access to all of this right away. We share setups with 100% open source code [music] . You can request as
[12:17] many codes as you like throughout the two months of support. You will learn from scratch how to set up various trading systems and obtain statistics to discover winning strategies. A training program
[12:30] designed to teach traders to be more than just ordinary investors [music], but developers of new strategies for the stock market. เฮ


⚡ Saved you 0h 12m reading this? Transcribe any YouTube video for free — no signup needed.