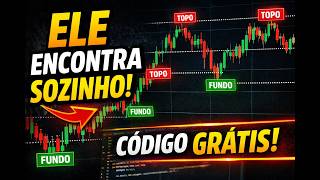

Auto Detect Support & Resistance – Free Code!
44sShows a simple setup to automatically find support and resistance, appealing to traders looking for easy tools.
▶ Play Clip"The title promises a free code that finds support and resistance automatically, and the video delivers exactly that."
This video tutorial demonstrates how to program a custom indicator in ProfitChart that automatically identifies support and resistance levels using the built-in Top-Bottom Detector. The presenter provides step-by-step coding instructions, including variable declaration, conditional logic, and plotting horizontal lines. The final indicator is intended for chart analysis only, not for automated strategy execution.
Navigate to the top menu, click on 'Strategies', then select 'Strategy Editor' to open the coding tool.
Create an input variable named 'topBottomPeriod' to allow external modification of the indicator period without editing the code.
Declare three float variables: 'topX', 'bottomX', and 'detector'. The 'detector' variable will store the value from the Top-Bottom Detector indicator.
Use the 'TopBottomDetector' indicator from ProfitChart's list, passing the input period. Assign its value to the 'detector' variable.
Use an if-else structure: if detector > 0 and detector equals the maximum, store the value in 'topX'. Else if detector > 0 and detector equals the minimum, store in 'bottomX'.
Use the 'HorizontalLineCustom' function to plot two lines: one for the top (lime green, thickness 2, style 1) and one for the bottom (red). Display the price value on each line.
The Top-Bottom Detector indicator is blocked for strategy automation because it updates past values and may not provide real-time updates. It is only suitable for chart analysis.
The custom indicator successfully plots support and resistance lines in real time, but it cannot be used for automated trading strategies due to the underlying indicator's limitations. The presenter encourages viewers to copy the code and test it on their charts.
What is the first step to create the indicator in ProfitChart?
Go to the top menu, click on 'Strategies', then select 'Strategy Editor'.
00:24
What is the purpose of the 'topBottomPeriod' input?
To allow external modification of the Top-Bottom Detector indicator period without editing the code.
00:53
What three float variables are declared in the code?
topX, bottomX, and detector.
01:36
How is the Top-Bottom Detector indicator assigned to the 'detector' variable?
By writing 'detector = TopBottomDetector(topBottomPeriod)'.
02:38
What condition indicates a new top (peak) has been found?
When detector > 0 and detector equals the maximum value.
04:55
What function is used to plot horizontal lines?
HorizontalLineCustom.
07:06
What color and thickness are used for the top line?
Lime green color, thickness 2.
07:36
Why is this indicator not suitable for strategy automation?
Because the Top-Bottom Detector updates past values and may not have real-time updates, so it is blocked in strategy automation.
09:15
Conditional Logic for Tops and Bottoms
Explains the core logic that distinguishes between support and resistance levels using max/min conditions.
04:14Plotting Horizontal Lines
Demonstrates how to visually represent support and resistance on the chart using custom functions.
07:06Indicator Limitation for Automation
Clarifies that the indicator is only for chart analysis, preventing misuse in automated strategies.
09:15[00:24] and resistance detector, the first thing you need to do is open the go to the top menu of your platform and click on the " strategies" option. Then you click here on the strategy editor option and it will
[00:38] strategy editor option and it will open this tool for you. the following. Let's put an input here. And here in this input location, we're going to
[00:53] And here in this input location, we're going to create the top-bottom period input. Look the trade number inside these parentheses. Do you know why I'm doing this? Yes, for the following reason, I'm going to use the top and bottom detector indicator that
[01:08] exists in Profit Chart, and I'm going to use it on period three. with the period for this indicator, which will be period three. And I'm doing this
[01:22] so that it can be modified externally to the code.
[01:36] used in the code. To do this, I'm going to write here, look, var, and declare the variables that I'm going to use in the code. There will be few variables. I will use the variable top X, the variable bottom X, and I
[01:49] will also use the variable detector. They will all be of type float, meaning they will be used to store numbers with decimals. In this variable, "detector," I will store the value of the top and bottom detector indicator. That's why I'm
[02:03] taking line six here, I'm putting the detector variable that I created above, and I put this assignment symbol so that I can assignment symbol so that I can store the
[02:16] value of the top and bottom detector indicator that exists in Profit Chart inside the detector variable.
[02:38] In Prop Chart, this indicator will be found under the following name, top button detector. See here? Here, in the list of indicators, you can see that we have this indicator here, the top- bottom detector. This is the indicator
[02:52] that returns the top and bottom detector for us. And this is the one I'm going to top and bottom detector for us. And this is the one I'm going to use to do our use to do our programming here.
[03:19] This parenthesis is here so I can specify the period of the indicator, the top and bottom detector, that I'm going to use. And the period is period three. But I've already created the input here. See? I created this input here, see, top
[03:34] bottom period. And to make things easier, I'm going to put this input inside these parentheses. By doing this, I will be able to modify the indicator period outside of the code. When I'm working with the
[03:47] double-click on it and modify the period from there. I don't need to do that here in the code. Once I did that, I already code. Once I did that, I already have the value stored in the
[04:00] detector variable, that is, the value of the tops and bottoms detector indicator is already stored in this variable here, detector. And now what I'm going to do is take this variable and create a logic using some
[04:14] conditional structures so that we can get the exact price of the support line and the resistance line and plot two horizontal lines. I'm going to use a C conditional structure
[04:30] to do the following: I'm going to perform a logical test. If the detector is greater than zero, here, look, a parenthesis here, this means that it obtained a new value, because if it is greater than zero, it's because it obtained
[04:42] a new value. So, from this point on, I want to store this new value that he obtained. But then I need to know if this new value refers to the top or the bottom. And for that, I'm going to add a second condition,
[04:55] which is the following: if detector is greater than zero and detector is equal to the maximum, then I have a new value obtained by the tops
[05:07] and bottoms detector indicator. And this value refers to a new peak, because here you can see that I've set the maximum. If it's the maximum, then it 's the top. This means the detector has reached a new maximum, which is where the peak will be. So, when that happens, I'm going to
[05:22] do the following: I'm going to take the variable `top X`, which I created above, and store this new top value that the indicator obtained inside that variable. So I'm going to take this here, and I'm going to put the
[05:37] value of the detector at this exact moment here into this variable 'top X', which was the moment when it here into this variable 'top X', which was the moment when it reached a new maximum or a new peak. reached a new maximum or a new peak. [music]
[06:02] do the same thing, but in reverse. The first condition will remain the same because the first condition here refers to the moment when the detector obtains a new value. So, when it acquires a new value, it becomes greater
[06:14] than zero, both for buying and selling. What will determine whether it's a peak or selling. What will determine whether it's a peak or a trough is the point where that new value is located. If this new detector value is positioned at a
[06:26] candle low, then that means I've found a bottom. This means that the top button detector indicator gave me a bottom point. So I'm going to store this bottom point here inside the variable bottomX, okay? This logic
[06:41] here will allow me to create an indicator that will pilot a horizontal line at the top point and a horizontal line at the bottom point.
[07:06] all I need to do is plot them on the graph. And I'm going to do that using the horizontal line custom function. This function here, horizontal line custom, allows me to plot custom horizontal lines on the chart,
[07:21] okay? And I'm going to plot two of these lines, one for the top and one for the bottom. first horizontal line, I'm going to ask for the value of the top. So, I'm putting the variable X here. And then I'm going to select the lime color. This color here
[07:36] refers to lime green. I'm going to ask for it to be plotted with a thickness of two and a style of one. And then I can put some text here. But in this case, I'm only going to ask him to show me that line displaying the
[07:53] example, "I'm in" instead of just asking for the price. Or I can write here, look, top X, and it will give me the numerical value of where this line is being piloted. We have more options here, in this case, like the
[08:07] font size and the text size. I'm setting the font size to 10 here. And we have more options, which in this case is the text positioning. Now , to make it easier, I'll copy and paste it below and then
[08:21] modify it. Now that I have the plot of the top, I need the plot of the bottom. So I'm going to put background X here, and the color I want is red. at this point will I ask him to tell me the fund's value,
[08:35] okay? And I'm going to keep the font size at 10. And the text positioning on the horizontal background line will also be in the top right of the line.
[09:03] simple, as you can see. You can pause the video, pause the video and copy that code into your Profit Chart. It's good that you're going to train already. Now, an important point here is that you'll notice this indicator is
[09:15] underlined down here. This means that this indicator cannot be used for strategy creation. It's only an indicator for chart analysis because the way its logic was built doesn't
[09:28] adapt to programming buy and sell strategies. This is because the Top Button Detector indicator updates past values and may not have real-time updates, therefore it's blocked in strategy automation,
[09:41] okay? So this indicator is only for chart analysis. When you run this on your chart, you'll notice that it will return a peak point and a trough point. The live chart is really cool, it
[09:54] works very well, as you can see in the videos I've been posting, it returns to you in real time the top point and the bottom point that is being formed on the chart. If you liked this video, just click the
[10:07] like button, and you can pause the video and copy this code into your Profit Chart, and you'll get this indicator from the video, okay? Pause here, copy this, and we'll see you in the next video. Receive the channel's various strategies.
[10:21] There are dozens of open-source codes that you can use freely in your profit chart. Enroll today and receive, in addition to various setups, complete training teaching you step-by-step how to create strategies in the
[10:34] Profit [music] Chart editor. And best of all, when you enroll, you get access to our support group, where we share various codes and create several strategies based on your feedback. [Music] Do you
[10:46] need to program a setup and don't know how? Through our support service, [music], we create the code for you. Enroll today and get access to all of this right away. [Music] We share setups with
[10:59] 100% open source code. You can request an unlimited number of codes throughout the two months of support. You will learn from scratch how to set up various
[11:11] [music] trading systems and obtain statistics to discover winning strategies. A training program designed to teach traders to be more than just new strategies for the stock market. เฮ

⚡ Saved you 0h 11m reading this? Transcribe any YouTube video for free — no signup needed.