
The First Candle Secret for Selling
45sReveals a specific, rule-based trading pattern that is easy to understand and apply, sparking curiosity and potential controversy among traders.
▶ Play Clip"The title promises a bizarre pattern, and the video delivers a specific Thursday-only anomaly, though the pattern itself is simple."
The video presents a trading strategy for the Brazilian Mini Index based on the first candle of the day on a 15-minute chart. The creator backtests the strategy across different weekdays and discovers that it only yields consistent profits on Thursdays, with a profit factor of 2.41 and a 70% win rate. Various modifications, including scalping with a 30-point target, achieve 100% accuracy in backtests.
For a sell trade, the first candle of the day on the 15-minute chart must be negative. Place a sell order at the low of that candle. If triggered on the next candle, enter with a 400-point target and 400-point stop loss.
For a buy trade, the first candle of the day must be positive. Place a buy order at the high of that candle. If triggered, enter with a 400-point target and 400-point stop loss.
Backtesting the strategy only on Mondays resulted in a poor capital curve, profit factor below 1, low win rate, and high drawdown.
Testing on Tuesday also produced a negative capital curve, profit factor below 1, and drawdown of 250%.
Wednesday's backtest showed poor performance with a messy capital curve and low profit factor.
Friday's backtest also resulted in a bad capital curve and high drawdown.
When Thursday was added to the backtest, the capital curve became upward-sloping. Excluding all other days and testing only on Thursday yielded a profit factor of 2.41, 126 trades, 70% win rate, and drawdown of 7.69%.
Adding a filter for the first candle body to be at least 100 points maintained an upward capital curve.
Instead of breakout entry, entering the market immediately at the close of the first candle also produced good results: 176 trades, profit factor 2.14, 68% win rate.
Using a 50-point target and 400-point stop loss resulted in a profit factor of 7.75, 98% win rate, and drawdown of 7.41%.
A 30-point target with 400-point stop loss achieved 100% accuracy with 126 trades and no drawdown.
The strategy can handle targets up to 800 points while maintaining an upward capital curve, but the ideal is a 1:1 risk-reward ratio.
The first candle of the day strategy on the 15-minute chart is only profitable on Thursdays, with various modifications (scalping, market entry) also showing strong backtest results. Traders should focus on Thursdays and consider adjusting targets and stops based on their risk tolerance.
What is the condition for a sell trade using the first candle of the day?
The first candle of the day on the 15-minute chart must be negative.
00:20
Where is the sell order placed in this strategy?
At the low of the first candle of the day.
00:48
What are the default target and stop loss for the basic strategy?
400 points target and 400 points stop loss.
00:48
On which day of the week does the strategy show consistent profitability?
Thursday.
06:41
What was the profit factor for the Thursday-only backtest?
2.41.
06:59
What was the win rate for the Thursday-only backtest?
70%.
06:59
What was the drawdown for the Thursday-only backtest?
7.69%.
06:59
What modification achieved 100% accuracy in backtests?
Using a 30-point target with a 400-point stop loss (scalping).
12:05
What is the maximum target the strategy can handle while maintaining an upward capital curve?
800 points.
12:37
What is the ideal risk-reward ratio for this strategy according to the creator?
1:1 (one-to-one).
12:52
Thursday Anomaly
The strategy only works on Thursdays, with a profit factor of 2.41 and 70% win rate, while other days fail.
06:41100% Accuracy Scalping
A 30-point target with 400-point stop loss achieved 126 trades with 100% accuracy in backtests.
12:05Thursday Pulls Up Curve
Including Thursday in the backtest dramatically improved the capital curve, while excluding it led to poor results.
05:12Minimum Candle Body Filter
Adding a filter for the first candle body to be at least 100 points maintained profitability.
07:46Market Entry Alternative
Entering the market immediately at the close of the first candle also produced good results with a profit factor of 2.14.
08:30[00:20] index, and this setup will work on selling in the following way. I will need the first candle of the day to be negative. I'm going to use this candle here as a signal candle to enter a sell position. So, look, I'll
[00:34] repeat it. I'm going to take the first candle of the day on the 15-minute chart. And in the case of a sale, I need that first candle of the day to be negative. If this condition occurs, I will place a sell order at
[00:48] the low of the first candle of the day on the 15-minute chart, and I will wait for the order to be executed. If the next candle executes this order, I will enter a sell position with a target of 400 points and a stop loss of 400 points, which can
[01:01] be modified, as I will show you throughout this video. Let's see how it went here. He went there, executed the order, breaking through the low of the first candle of the day and reaching the target of 400 points. When making a purchase, I'll
[01:15] work the same way, but with the logic reversed. Look, I've picked an example here for us to see. This is the 15-minute chart. And to make a purchase transaction, I'm going to use the first candle of the day as a basis, only the first
[01:28] candle of the day. And I need that first candle of the day on the 15- first candle of the day on the 15- minute chart to be positive. If the first candle of the day on the 15- minute chart closes positive, I will
[01:40] place a buy order at its high. Logically, I have to wait for the first candle of the day to close. As soon as it closes in the positive, I have my buy order for this strategy. Then I place a
[01:53] buy order positioned at the high of that signal candle. If this order is triggered on the next candle, I will enter a buy position with a target of 400 points and a stop loss of 400 points. Let's see how it went. Look, it broke through the high of the first candle
[02:08] of the day and went straight to the target. If the first candle of the day is positive, place a buy order at the high. If the first candle of the day is negative, place a sell order at the low. Another negative first candle of the day here. What did he do?
[02:21] He placed a sell order at the lowest point. Then the next candle broke out, and he entered a sell position with a target of 400 points and a stop loss of 400 points. Immediately following that, we had a purchase situation here. Look, it came back positive. What does this setup do?
[02:35] Place a buy order at the high, targeting 400 points with a 400-point stop loss. So I want to show you the backtests of this so we can see how it has worked over time. I already have the
[02:48] backtest screen here. I'll start testing this setup on Monday so we can see what happens . Look, it's Monday and I'm going to test this pattern using the first candle of the day only on Mondays. Let's see how it
[03:00] terrible, didn't it? We can see it here, look. I've been testing it since Very poor capital curve. This system of trading the first candle of the day using Monday as a base really didn't work here, and the
[03:15] statistics were terrible. Look, there were 125 trades with very poor profit factors, below one, a poor win rate as well, and a huge drawdown. So this system didn't work on Monday. Let's test it on Tuesday
[03:32] so we can see. Look, I'm going to restart the backtest here and run the test on this system only on Tuesday. The capital curve also turned out very bad . Look, it got really messy and ended up in the negative.
[03:48] ended up in the negative. Testing here since October 1, 2021. We had these statistics here. It ended up here with a profit factor below one here with a profit factor below one and an even higher drodal of 250%.
[04:02] It turned out awful, didn't it? I'll test it on Wednesday so we can see. Look, on Wednesday that system of trading the first candle of the day also went very badly. Look here
[04:14] day also went very badly. Look here . That didn't work either. And these are the statistics here. Right? A huge mess here. So, that didn't work here on Wednesday, right? I'll test it on Friday so
[04:29] we can see. Just look. We'll look at this system on Friday. And it also ended up with this capital curve here . Very bad. This is a really big drodal here. The curve didn't turn out well here either. Just look. Let's do the
[04:44] here either. Just look. Let's do the following, then. We'll test this system on Monday, Tuesday, Wednesday, and leave Friday here. Let 's see how it turns out. Just look. Let's see. I'm testing it these days, you know
[04:59] . It got pretty bad, can you see the capital curve? Operating this system on capital curve? Operating this system on Monday, Tuesday, Wednesday, and Friday, the capital curve looked like this. So, I'm going to include Thursday
[05:12] here. I'll include Thursday. So, I'll end up operating every day of the week. Let's see how it turned out. was pulled upwards, right? It's impressive because I had tested it
[05:28] on Monday, Tuesday, Wednesday, and Friday, and the capital curve was terrible. I entered Thursday, and then the capital curve, in a very interesting way, was pulled upwards. So let's do the following: I'm going to remove Monday, I'm
[05:44] going to remove Tuesday, I'm going to remove Wednesday, and I'm going to remove Friday. And I'm just going to leave Thursday to see why that capital curve rose so much when I capital curve rose so much when I included Thursday.
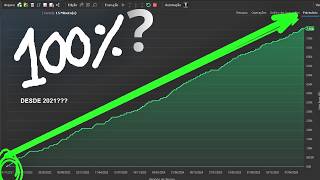
[06:03] Thursday, look at this capital curve. Look at this. An extremely upward-sloping capital curve
[06:15] what's happening here on Thursday, using the first candle of the day. Since 2021, this pattern on Thursdays
[06:27] has produced an extremely upward-sloping capital curve, something completely out of the ordinary that hasn't happened on Mondays, Tuesdays, Wednesdays, or Fridays.
[06:41] Fridays. This pattern is only happening here on Thursdays. Look, we have these statistics here. A profit factor of 2.41, 126 trades with a 70% success rate, and a payoff of 1 with a drawdown of 7.69%.
[06:59] Take a look at the chart of the operations. It's impressive how profitable this pattern in the first candle of the day is proving to be on Thursday. You realize he only operates on Thursdays, right? He will only have surgery on Thursday. And by working
[07:15] produce this extremely upward-sloping capital curve. And when I insert Monday, Tuesday, Wednesday, and Friday, it completely destroys the capital curve, right? It's impressive.
[07:30] And I can make modifications, right? I can modify this from here. Look, I 'm using this pure system here. I can put some details here. For example, I have this input here which refers to the minimum size of the
[07:46] entry candle body. I set the size to zero, but if I want, I can an entry on the first candle of the day, I need its body to have at least 100 points. Let's see how it goes. Look, if I use the first
[08:02] candle of the day with a body of at least 100 points, I also have this capital fault here, very cool, with these statistics. I can specify, for example, that he
[08:14] points. Let's see what the capital curve looks like. Look, I have this capital curve here, also very upward sloping. I can also make a very interesting modification, which is the following: I can enter the market as soon as I
[08:30] see the close of the first candle of the day. I don't expect the order to be executed on a breakout of the high or low, you know. I go straight to the market. Let's see how this turns out. Entering the
[08:45] market. Look, look how the capital curve turned out. These statistics are very interesting. Just look. We had 176 trades here with a profit factor of 2.14, a success rate of 68% with a payoff of
[09:02] one, and this capital curve here representing the market entry. Look how this market entry process works . In this case, I have an example of a sale in the chart, right?
[09:15] When I ask the robot to enter the market as soon as the first candle of the day closes negative, it immediately enters a market sell order. He's not going to place that order
[09:30] at the low here and wait for execution; he's going straight into a sell order with a target of 400 points and a stop loss of 400 points. By doing this, he also obtained this capital curve here, which is very good. See? V-shaped capital is quite interesting, allowing for
[09:45] market entry. And I'm using the filter, right? The filter here for the filter, right? The filter here for the candle body needs to be at least 100 points. The size of the candle body. I can put this
[10:00] as zero, right? Because I'm not going to use that filter. And then I would use that filter. And then I would have these statistics here, look. Oh, that's very interesting too. The upward-sloping capital curve
[10:15] quite interesting to see how this capital curve has been rising with a perfect one-to-one model, isn't it? He realizes that when he loses, he's going to lose 400 points. When he gets it right, he'll score 400 points. He gradually rose in the ranks, you know,
[10:28] over time. Very good. Oh, notice here, oh, poof of one. Let's state here that I need the candle body to
[10:40] have at least 500 points in order for me to make an entry. Let's see. If I put this in, it ended up like this , see? The number of entries has decreased quite a bit, has , see? The number of entries has decreased quite a bit, has n't it? And I've had these statistics here
[10:52] throughout this period. Right? Look how interesting. I'm going to remove the market entry. I took the market entry. I will normally enter the market on the breakout of the high or low. And I'm going to reduce the target here, for example,
[11:09] to 50 points. Let's see. I'm going to test it in a scalping model so we can see what scalping model so we can see what the capital curve looks like in this system. Look at this. In the scalping model, working with a target of 50 points and a stop loss
[11:24] of 400 points, he achieved this capital curve here with these statistics capital curve here with these statistics here. Look at that, a profit factor of 7.75 here. Look at that, a profit factor of 7.75 with a total of 126 trades, a 98%
[11:38] success rate. The payoff is low, right? Using this model here with a 50-point target, a this model here with a 50-point target, a 400-point stop, and a drawdown of 400-point stop, and a drawdown of 7.41, but it also works, right, in the
[11:52] scalping model, which is what we're seeing here. If I set a very short target of 30 If I set a very short target of 30 points with a stop loss of 400 points, the statistics will be like this: Look at that, the capital curve is completely
[12:05] Look at that, the capital curve is completely upward trending here in the backtest upward trending here in the backtest since 2021. Look here, there haven't been any stop-loss orders, right? Throughout this entire period. There were 126 operations with 100% accuracy. There
[12:20] 's no dodal, there aren't any other numbers here because it hasn't been stopped yet, right? Here, only profitable trades are being made, working with this very short target of 30 points. This model will accept a target of up to 800 points. That's the
[12:37] maximum he can achieve, a target of 800 points. From that point on, it starts to this case, with a target of 800 points, it maintains the upward capital curve even with these statistics. But
[12:52] according to backtests, the ideal scenario for this model is to remain one-on-one. The curve ended up like this. If I put the entry up for market, let's see how it goes. The capital curve, the capital curve with market entry,
[13:06] ended up like this one here. That's very interesting too, okay? This is rising while working with a target of 800 points and a stop of 400 points, aiming for a two-to-one ratio, as you can see here in the payoff. These were the statistics. He
[13:20] made 230 trades with a 14% drawdown, and the resulting capital curve with a 14% drawdown, and the resulting capital curve looks like this. I can modify the stop as well. If I place a shorter stop ,
[13:36] for example, of 200 points, and aim for a target of 800 points, making a market entry. Let's see what the capital curve looks like. Look, this is the one that's left. The
[13:48] capital curve has been rising according to these statistics here. Payoff of four to one. And here is the chart of the operations. So, there are several
[14:00] ways to work with this pattern that has only been happening on Thursdays. Only on Thursday. Very interesting. If I test it on all the other days of the week, it's amazing how it doesn't work the same way it does
[14:16] on Thursday, you see? It doesn't work . It becomes very erratic and simply fails to produce an fails to produce an
[14:29] share this find with you all, right? This profitable pattern using the first candle of the day on the 15-minute chart is only happening on Thursdays. If you enjoyed this video, just click the
[14:43] like button and we'll see you in the next one. Receive the channel's various strategies. There are dozens of open-source codes that you can use freely in your profit chart. Enroll today and receive, in addition to various setups,
[14:57] complete training teaching you step-by-step how to create strategies in the Profit Chart editor. And best of all, when you enroll, you get access to our support group, where we share various codes and
[15:10] create several strategies based on your feedback. Do you need to program a setup and don't know how? Through our support service, we create the code for you. Enroll today and get access to all of this right away
[15:24] . We share the setups with 100% open source code. You can request as many codes as you like throughout the two months of support. You will learn from scratch how to set up various trading systems and
[15:39] obtain statistics to discover winning strategies. A training program designed to teach traders to be more than just ordinary investors; they should develop new strategies for the stock market.



⚡ Saved you 0h 16m reading this? Transcribe any YouTube video for free — no signup needed.