
92% Win Rate Trading Pattern
45sReveals a specific profitable trading pattern with a high success rate, sparking curiosity among traders.
▶ Play Clip"Title accurately promises 98% accuracy with target adjustment; video delivers the strategy and backtest results."
This video reveals a trading strategy for the Brazilian mini-index (mini-índice) that achieves up to 98% accuracy by trading only on Tuesdays, Thursdays, and Fridays. The strategy is based on the first 5-minute candle of the day and requires a minimum 1000-point move in the previous day's direction.
The strategy uses the 5-minute chart of the futures index and works only on Tuesdays, Thursdays, and Fridays. It has a 92% success rate with a profit factor of 3.58 since July 14, 2022.
For a buy trade, the previous day must have closed at least 1000 points higher than its open. This confirms a strong bullish day.
After confirming the previous day's move, wait for the first 5-minute candle of the current day to close. Place a buy order at its high with a target of 120 points and a stop loss of 390 points.
For a sell trade, the previous day must have closed at least 1000 points lower than its open. Place a sell order at the low of the first 5-minute candle with the same target and stop.
Since July 14, 2022, the strategy executed 101 trades with a 92% success rate, profit factor 3.58, payoff 0.31, and profit margin 8.58%.
Reducing the target to 100 points increases accuracy to 95% with profit factor 4.92. A target of 30 points yields 98% accuracy but increases drawdown to 17%.
The strategy fails on Mondays and Wednesdays. Backtesting on those days shows a poor equity curve, confirming the pattern only works on Tuesday, Thursday, and Friday.
This high-accuracy trading strategy for the mini-index is strictly day-dependent and relies on the previous day's momentum. Traders can adjust the target to balance accuracy and drawdown, but should avoid trading on Mondays and Wednesdays.
On which days of the week does this trading strategy work?
Tuesday, Thursday, and Friday.
00:21
What is the minimum required price movement on the previous day for a buy trade?
At least 1000 points upward.
01:45
What is the default target and stop loss for this strategy?
Target: 120 points, Stop loss: 390 points.
03:52
What is the success rate of the strategy with default settings?
92%.
00:51
What is the profit factor with default settings?
3.58.
01:04
What happens to the success rate when the target is reduced to 100 points?
It increases to 95%.
09:30
What is the success rate with a target of 30 points?
98%.
10:34
Why does the strategy not work on Mondays and Wednesdays?
Backtesting shows a poor equity curve on those days; the pattern is not effective.
13:09
How many trades were executed in the backtest since July 14, 2022?
101 trades.
08:36
What is the payoff ratio with default settings?
0.31.
08:49
92% Success Rate
Demonstrates the strategy's high accuracy over 101 trades since July 2022.
00:51Profit Factor 3.58
Indicates strong risk-adjusted returns.
01:04Target Adjustment for Higher Accuracy
Shows how reducing target to 100 points boosts accuracy to 95%.
09:30Day-of-Week Dependency
Highlights the importance of testing strategies on different days; pattern fails on Monday/Wednesday.
12:5698% Accuracy with 30-Point Target
Extreme target reduction yields near-perfect accuracy but increases drawdown risk.
10:34[00:21] Thursdays, and Fridays on the 5-minute chart of the futures index. By doing it this way, he obtained an excellent trading report here, working with this target and this stop loss. This can be modified so that
[00:36] we can achieve an even higher success rate than we already have here. This setup, curiously, only works on Tuesdays, Thursdays, and Fridays. He ignores the second and fourth. This has produced a very upward capital curve for us
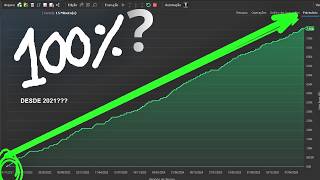
[00:51] a very upward capital curve for us since July 14, 2022, with a 92% success rate. And that hit rate can go up even more, it can go up even more because I can reduce the target size and thus achieve an even higher hit rate
[01:04] . Profit factor of 3.58. So it's a pattern that's quite profitable working those three days a week. I'll continue sharing the statistics with you here, but before that, I
[01:16] want to share how this strategy works. This setup will use the first candle of the day on the 5-minute chart as a base. One able to execute a buy operation within this strategy is that the day before the day
[01:32] I am making the operation must have been a day of rising prices. This is the first candle of the day on the 5- minute chart where I would technically be making the trade. In order for me to execute the purchase operation here, I
[01:45] have to look at the previous day's movement on the chart. Look, I'm looking at the activity from the previous day. And what do I need to have happened here? I need there to have been a day when the price increased by at least 1000 points.
[02:00] How will I know if this happened? I'll simply look at the previous day's opening and closing prices . And I need that movement to have been at least 1000 points. If that happened,
[02:14] if I had a variation of at least 1000 points here, I have confirmation that I had an excellent bullish day here on the day before the first candle of the day, where I'm looking to place the trade. Look, take
[02:29] the opening price from the previous day and drag it down to the closing price of that previous day. Here we had a variation of approximately 1314 points. So it was an upward variation of at least 1000 points. This is excellent for
[02:43] this strategy because, since I'm looking to buy, I have confirmation that the previous day was a very good day for buying. Once I have confirmation that the previous day was a day of gains of at
[02:56] least 1000 points, I just need to wait for the first candle of the day on the 5-minute chart to close. But there's an important detail I mentioned to you: I can't do this on just any day of the week. I only work
[03:08] any day of the week. I only work here on three specific days: Tuesday, Thursday, and Friday. It's only three days. If I 'm on Monday or Wednesday, I ignore that signal because it's not an effective signal on Monday
[03:23] or Wednesday. It is only an effective signal on Tuesday, Thursday, and Friday. So, once I have confirmation of all the conditions for this strategy, as I mentioned, I'm going to place a buy order here at the
[03:37] high of the first candle of the day on the 5-minute chart. As soon as it candle to close. He closed the deal, so I'm placing this buy order here. If this order is executed, I enter the trade with a target of 120 points and a stop of 390 points,
[03:52] as was the case here. Look, the target was hit here, 120 points, and the hit here, 120 points, and the stop loss was 390 points. It would be more or less here, look. What's interesting about this strategy is that it only performs one
[04:05] operation per day, on Tuesday, Thursday, or Friday. This operation is based on the first candle of the day on the 5-minute chart. I'll give you another example of a purchase so we can understand the strategy. So, look, I'm here with another
[04:19] example in the chart to explain how this setup works when buying. This is the first candle of the day on the 5-minute chart. When this candle opens, I have to do the following: I have to look at the previous day and see if I had
[04:34] the minimum necessary upward variation. How am I supposed to know that? All I have to do is compare the opening price with the closing price from the previous day. Because for me to make a buy order, I need the previous day to have been
[04:47] a day with at least a 1000-point increase. To find that out, I take the opening price from the previous day and pull it down to the closing price from the previous day. There it is , around 100 points up, right? It's true? So I have
[05:02] confirmation here that the previous day was a day of gains of at least 1000 points. After that, I just need to wait for the first candle of the day on the 5- minute chart to close. He has to shut it down. It will open at 9:00 AM and close at 9:05 AM.
[05:18] minutes for the candle to open until it closes. And to repeat myself once more, I can only do this if it's on Tuesday, Thursday, or Friday. Whether it's Monday or Wednesday, I'm not going to have the operation. I
[05:33] will not use this pattern on those two days of the week. So, look, I'm placing a buy order here at its high with a target of 120 points and a stop loss of 390 points. Look, the buy order has been executed.
[05:47] Let's see. You can tell he's taking a while to move in your favor, right? It was trying to hit the stop, but it bounced back and hit the target. See? This
[06:01] strategy here is very interesting. She has a very high success rate. Working here with a target of 120, she already achieves a success rate of around 90%. So the stop-loss low point of the first candle
[06:15] of the day. The opposite will happen during the sale . I'm here with an example of sales in the graph so we can understand how it works. Look, this is October 10, 2025. Here's the first
[06:29] October 10, 2025. Here's the first candle of the day on the 5-minute chart. What do I need to have a sales operation? I need the previous day—it has to be the previous day—to have been a day with a negative variation
[06:44] of at least 1000 points. So, look, I'm going to take this and look at the previous day to see what the variation was here. To find out, I have to click here, from the opening of the first candle of the
[06:57] previous day to the closing of the last candle of the previous day. And there you have it, a negative variation of approximately 100 points. Basically, what I want in this setup, in the case of selling, is for the previous day to have been
[07:12] a day of considerable decline, right? And in the case of a purchase, I want the previous day to have been a day of considerable gains, and 1000 points is a considerable gains, and 1000 points is a very good round score, right, to be
[07:25] able to make that decision. So if the previous day was a day of decline of at least 1000 points, I can already place a sell order here on this first candle of the day on the 5- minute chart. I just need to wait for it to close,
[07:40] right? The moment it closes, I'll place a sell order here at the low. This setup will enter with a stop loss of 390 points. Look at that, right? It stayed here, well above the high of the first candle of the day on the 5-minute chart. It's way
[07:56] up here, look. Stop was here more or less, or less, right? The stop loss for the trade was here right? The stop loss for the trade was here and the target was 120 points. 120 points.
[08:10] Let's see. He hit the bullseye. See? This setup will perform a single operation per day, This setup will perform a single operation per day, and that operation will occur and that operation will occur either on Tuesday, Thursday, or Friday.
[08:22] This setup has three days a week for trading. It works like this : Look, this setup has been performing really well since 2022. The capital curve is like this one here. Since July 14, 2022,
[08:36] he has achieved an excellent capital curve after 101 trades. The capital curve after 101 trades. The profit factor is quite high, at 3.58, with a profit factor is quite high, at 3.58, with a 92% success rate, a payoff of 0.31, and a profit
[08:49] margin of 8.58%. Here is the chart of the operations. As you can see, this setup experienced very few stop-loss orders throughout this entire trading period. The strategy's trade list shows several
[09:03] profitable trades. And I want to share with you all a really cool modification here so we can see that it 's possible to increase the success rate of this strategy by reducing the target. Look , if I set a
[09:16] target of 100 points here, for example, I'll still have great statistics with this setup. And I can even broaden the scope of this strategy. I'm going to make a few adjustments here so we can take a look. Look, simply by reducing the target to 100
[09:30] points, I significantly increase the hit rate to 95%, which is a hit rate to 95%, which is a profit factor of 4.92. There you go, the capital curve, this one here, simply setting a target of 100 points with a stop loss of
[09:45] 390 points. Look at that, the capital curve is definitely rising. If I reduce it further, setting a target of 80 points, for example, let's see how it goes, right? I set a target of 80 points with a stop loss of 390 points. Look, the success rate remains
[10:00] at 95%, right? With these statistics here. You can pause the video and look at each of the statistics. We're going to make a more significant reduction here. I'm going to set a target of 30 points here. A target of 30 points with a stop of 390 points,
[10:17] simply so we can look at the statistics and see these different types of target and stop values in the strategy. Look, I've set a target of 30 points here with a stop loss of 390 points. The success rate hit 98% here.
[10:34] It has these statistics, as you can see, look, you can pause the video and see for yourself. Logically, when we reduce our target significantly, when we trigger a stop-loss, the equity curve feels it much more, right? You can see it in the
[10:47] drodal here, look, it's at 17%. Ideally, we shouldn't lower the target too much so that we have a healthier capital curve over time. Look here, let's do the following: I'm going to set a target of 200 points so
[11:01] we can look at the statistics. Look, a target of 200 points with a stop loss of 390 points. So we can look at the statistics for this strategy. Look, the upward capital curve continues, and we have these statistics here. 101 trades, 78%
[11:18] accuracy. This one has a target of 200 points and a stop loss of 390 points. If I increase it even more, putting it here, one to one, 390 points target and 390 points
[11:31] stop, I have these statistics here. Just look. Let's see. Look , it ends up like this, putting them one by one, and you get these statistics here.
[11:46] As you can see, I can reduce it as well, I can reduce the stop. For example, if I reduce the stop to 220, let's see what the to 220, let's see what the equity curve looks like. I'm reducing the stop loss, so it'll
[12:01] be a shorter stop loss, right? A target of 100 points. Let's see how it goes. Oh, the capital curve looks like this with these statistics here. Ideally, these statistics here. Ideally, for this strategy, the target would be
[12:15] 120 points, with a stop loss of 390 points. The capital curve looks quite interesting. Look at this great capital curve, right? Now I want to show you the following. I told you that this setup only works three days a
[12:28] week, right? To prove this, I'll show you the statistics here. This capital curve that you're seeing here is a capital curve that takes into account the third, fifth, and sixth periods. I'm going to show you a
[12:42] capital curve focusing only on Mondays and Wednesdays so you can see what Wednesdays so you can see what this pattern looks like on Mondays and Wednesdays.
[12:56] I'll show you how it turned out. Look, I'm going to backtest this strategy on Monday and Wednesday so you can see how the capital curve looks on those two days of the week
[13:09] that I excluded from the setup. Look, let's see. It stays like this, you see? It simply doesn't work. It doesn't work here. If we use Monday and Wednesday,
[13:21] the setup won't work. It doesn't work on those two days. The standard pattern simply is n't effective, even if I reduce the target. Let's see here, with 50 reduce the target. Let's see here, with 50 points. Let's see how it goes.
[13:36] But this setup works very well on Tuesday, Thursday, and Friday. Look there, can you see? It doesn't work. It simply does n't work on Mondays and Wednesdays. strategies. This is actually a very interesting tip for those who develop
[13:51] setups. Test your setups on different days of the week to find out, because there are days when the pattern simply doesn't work. It may work on several other days of the week, but there may be one
[14:03] specific day when the pattern is terrible. Look, testing this same strategy that I showed you on Monday and Wednesday, I got this terrible capital curve here. And on Wednesday I had this terrible capital curve here, okay?
[14:18] enjoyed this video, give it a like, subscribe to the channel, and we'll see you in the next video. Receive the channel's various strategies. There are dozens of open-source codes that you can use freely in your profit
[14:31] chart. [Music] Enroll today and receive, in addition to various setups, complete training teaching you step-by- step how to create strategies in the Profit Chart editor. [music] And best of all, when you enroll,
[14:44] you get access to our support group, where we share various codes and create several strategies based on your feedback. Do you need to program a [music] setup and don't know how? Through our
[14:57] support service, we create the code for you. [music] Enroll today and get access to all of this today. We share the setups with 100% open source code. [music] You can request an unlimited number of codes throughout
[15:11] the two months of support. You will learn from scratch how to set up various trading systems [music] and obtain statistics to discover winning strategies. A training program designed to teach
[15:23] traders to be more than just ordinary investors; they must develop new strategies for the stock market.


⚡ Saved you 0h 15m reading this? Transcribe any YouTube video for free — no signup needed.