

90% of Moving Average Strategies Fail
42sHigh engagement from a bold claim about failure rates, sparking curiosity and debate among traders.
▶ Play Clip"Title accurately promises a moving average strategy for beginners; the video delivers a detailed, step-by-step tutorial."
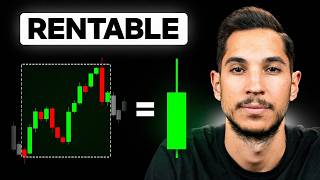
This video teaches a moving average trading strategy used by a client at an investment bank, which generated huge returns. The strategy uses three exponential moving averages (50, 100, and 150 periods) on one-minute charts for scalping, focusing on trend detection and pullback entries.
Moving averages are popular because they make charts visual and facilitate decision-making. The speaker uses 50-period (red) and 200-period (purple) moving averages in all charts to detect support/resistance and trend direction.
Exponential moving averages (EMA) give more weight to recent price movements, making them more sensitive to trend changes. Simple moving averages give equal weight to all periods, which is less useful for this strategy.
The strategy uses three EMAs: 50-period (short-term), 100-period (medium-term), and 150-period (long-term). This trio helps detect trend direction and intensity. They are added in TradingView by selecting 'Exponential Moving Average' three times and configuring each.
A trend is identified when all three moving averages are aligned in the same direction, parallel, and ordered (50 above 100 above 150 for uptrend, reversed for downtrend). The price should be above (bullish) or below (bearish) the averages.
After identifying a trend, look for a pullback where the price breaks above the 50-period EMA. The ideal entry zone is between the 50 and 100 EMAs. Enter when the price breaks back in the direction of the trend, with stop loss below the previous low and take profit at previous highs.
The original strategy was aggressive: move stop loss to breakeven after a 25% move in profit. Alternative: use a risk-reward ratio of 1.5 or exit when price breaks the 50-period EMA. Risk per trade should be 0.25-0.5% for beginners.
This moving average strategy is designed for scalping on one-minute charts, focusing on trend alignment and pullback entries. Proper position management and risk control are critical for success, and beginners should practice on demo accounts first.
Why does the strategy use exponential moving averages instead of simple moving averages?
Exponential moving averages give more weight to recent price movements, making them more sensitive to trend changes.
03:48
What are the three EMA periods used in this strategy?
50-period, 100-period, and 150-period.
05:12
How do you identify a bullish trend using the three EMAs?
All three EMAs are aligned in the same direction, parallel, ordered (50 above 100 above 150), and the price is above them.
06:45
What is the ideal entry zone for a pullback in an uptrend?
Between the 50-period EMA and the 100-period EMA.
09:37
What is the aggressive position management technique described?
Move the stop loss to breakeven when the price moves 25% of the distance from the stop loss to the entry.
10:57
What alternative exit strategy is suggested for less aggressive traders?
Use a risk-reward ratio of 1.5 or exit when the price breaks the 50-period EMA.
12:07
What is the recommended risk per trade for beginners testing this strategy?
0.25% of capital.
12:51
Exponential vs Simple Moving Averages
Explains the key reason for using EMAs: sensitivity to recent price changes, which is critical for scalping.
03:48Trend Detection with Three EMAs
Provides a clear, visual method to identify trend direction and strength using alignment of three moving averages.
06:45Pullback Entry Strategy
Describes a specific entry setup that exploits novice traders' mistakes during pullbacks.
08:27Aggressive Position Management
Highlights a high-risk, high-reward approach to scalping with breakeven adjustments.
10:17[00:01] the best ways to trade because it uses a very common indicator that makes the chart much more visual, facilitating decision-making. The problem with moving averages is that there are countless strategies, and 90% of them are
[00:15] n't profitable. So, in this video, I'm going to teach you a moving average trading strategy that one of the clients at the investment bank where I used to work used, and it generated huge returns. Beyond
[00:28] of the strategy is that it goes with the trend, taking the money from those novice traders who don't properly understand price action concepts. It's a strategy that I've personally never
[00:42] used, but I've found it to be profitable. Furthermore, I think it's one of the best trading strategies that can be used with moving averages, and it 's perfect for both beginners and
[01:01] trading, simply because the ease with which you can interpret them allows many strategies to be structured around them. I personally don't base my strategies on
[01:15] moving averages, but I do... I keep them in mind, especially the most common ones, as you'll see. This allows me to make the chart and the strategy much more visual and recognizable. In fact, if we go directly to the chart, as you can
[01:28] see, I usually have two moving averages in all my charts. The red one is the 50-period moving average, and the purple one is the 200-period moving average. Notice how it's not a coincidence that what the price usually does after
[01:43] forming some kind of breakout—here we have it—breaks this structure, it also breaks the moving averages, and the first thing it does is go to find the moving average. Then the trend is constantly supported
[01:56] trend is constantly supported by the 50-period moving average. Notice another new breakout. And what does the price automatically do? It breaks and finds support at the moving average, and then the trend is structured around that
[02:09] same moving average. And you can see this constantly. Here we have another breakout of this diagonal level. What does the price do? It makes an impulse, finds support at the moving average, and then continues. Yes, it's true that it reverses, but it doesn't matter
[02:23] because you don't want this profitability taken away. So, the red moving average, that is, the 50-period moving average... One last example where we have this clear breakout: the price breaks out, finds support at the moving average, and continues. Then the
[02:38] trend is based on that moving average. I use the 50-period moving average simply to detect these levels, and the 200-period moving average, that is, the purple moving average, as you can see, is a fairly long moving average that
[02:50] allows me to quickly and visually interpret that regardless of what regardless of whether a structure like a range is forming, as long as it's below the 200-period moving average, it's in a downtrend. Therefore, what I
[03:05] be interested in is looking for short positions, looking for any excuse on the chart to go short. The same thing happens when the moving average is below the price, no matter how much the price has fallen. Here
[03:20] we have a big drop, but it doesn't matter to me because the 200-period moving average is below it, so I have to be on the lookout for quick example of how I use moving averages. They aren't based on all the pillars
[03:34] of my strategy, but they are very useful. Well, in this video, I'll show you... I'm going to explain a trading strategy that is 100% based on trading strategy that is 100% based on
[03:48] exponential moving averages. But why exponential? Simply because the exponential moving average gives more weight to recent price movements, making it much more sensitive to trend changes. In contrast, a simple moving average
[04:02] gives the same weight to a structure formed 5 hours ago as to one formed 50 hours ago, and that's not what we're interested in. You'll see why later. And why three moving averages? Well, many
[04:16] traders use different moving averages, usually two, to gauge direction and pullbacks in the short and medium term. We'll use a trio of moving averages, firstly to detect the short,
[04:30] medium, and long term, and secondly because we can more clearly measure the intensity of the trend, whether it's bullish or bearish. To do this, go to TradingView in the upper left corner where it says "
[04:43] Indicators," and in the search bar, type " EMA." Click where it says "Exponential Moving Average." You have to click three times because we're going to use three moving averages. So, after the first one, you click a second, and then
[04:56] a third. Once you have the three moving averages, all you have to do is configure them. Double-click on them, and where it says " data input," leave the first one at 50 and click " accept." Leave the second one at
[05:12] accept." Leave the second one at 100 and click "accept." Leave the third one at 150 by adding a 1 before the 5 and click "accept." Now you have the three moving averages, and you can see them on the screen. The 50-period moving average gives you a
[05:28] short-term direction. The 100-period moving average gives a more general medium-term direction, accepting certain types of pullbacks. Finally, the 150-period moving average gives a much longer-term direction. If
[05:43] much longer-term direction. If this moving average is broken, as you can see, it can lead to a clear trend reversal. Hey Alex, can this strategy be used with other moving averages, like the
[05:56] 5, 10, and 15-period ones? The answer is yes. But keep one thing in mind: we're talking about one-minute trading, so... I will explain this more clearly, and volatility in this same operation. If you use moving averages as short
[06:13] as the CCO, the 10, and the 15, what will happen is that you will be executing positions all day because you increase volatility even more. In that case, through the 50, 100, and 150 moving averages, we absorb a large
[06:30] operating on one-minute charts, but we will discuss this further later. The second step is based on detecting the setup that interests us. What we are looking for is a trend, either bullish or bearish. But how can we
[06:45] clearly detect the trend? Simply by looking for movements where the three moving averages are aligned in the same direction, parallel, completely ordered, and with the chart above or
[06:58] below. If it is above, it will be a bullish trend, and if it is directly to the chart because you will understand it much better. Look at this case, we have the three moving averages ordered. First, the The 50-period moving average, then the
[07:14] 100-period moving average, and then the 150-period moving average are parallel, and the chart is above it, indicating an upward trend. In this case, what we have are the three moving averages in the same order, pointing downwards, and the price below, which means we
[07:29] are in a downward trend. This happens in phases. There are impulsive phases where we will have these three moving averages in order, and corrective phases where they will not be in order. We are interested in this phase here. Why? Because there is no
[07:44] trend; a pullback is forming. We are interested in, for example, this one here where the price forms a completely ordered movement. Then what happens? It enters a horizontal movement. And what
[08:00] we are going to look for within this situation, and you will see this in this example here, is that within this trend, within this direction, as you can see here, we return to an impulsive movement where the three moving averages
[08:14] are completely ordered. It is the pullback. What interests us is that the price makes a pullback; that is, within maintaining a trend, we want a discount in the movement, and we will find this at the moment when... The
[08:27] we will find this at the moment when... The first thing you need to look for is a break above the 50-period moving average. So, what you're interested in is looking for the trend first, and then a pullback. You'll interpret the pullback when this break above the 50-period moving average occurs.
[08:41] Keep in mind that many beginner traders, when this breakout occurs, try to go short. What we're going to do with this trading strategy is take the money from these traders who don't
[08:54] properly understand the market as extra points. Within this second step, related to the setup, and before moving on to the two most important steps of the strategy, remember that it operates using scalping with
[09:07] one-minute charts. This person traded only the Euro, the Dollar, only the DAX ( German index), and only the Dow Jones (US index), and did so during the first three hours of each session. Step three is about
[09:23] execution and exit. During the pullback, we don't want the price to close below the 100-period moving average, nor do we want it to approach the 150-period moving average. Therefore, our ideal data range is
[09:37] ideal data range is precisely between the... The 50-period EMA and the 100-period MAA are then in contact with our target zone, and when the price enters and breaks back in the direction of the trend, that 50-period moving average indicates the
[09:51] end of the pullback. What we're going to do is execute the position at market, placing a stop loss below the previous low (in this case, a long position) and a take profit at the previous highs. Later on, I'll
[10:04] explain the basics of position management, which are crucial. But for now, remember this: the last step, and I would venture to say the most important, is position management. Here, I want to clarify two
[10:17] remember that we're talking about scalping with one-minute charts, which means extreme volatility. You have to be more aggressive than usual in managing your positions, as the market can change in a matter of
[10:31] seconds. The second point is that this person was extremely aggressive. I like to enter and exit quickly, but I'm nowhere near as aggressive as this person. So, what I'm going to do next is explain how he
[10:45] managed the positions, and then I'll give alternatives for those who do n't want to do it the same way. The thing is, when I executed the position, as I've already mentioned, I placed the Stop Loss below the previous low
[10:57] and the Take Profit at the maximum in this case because we were going long. Well, just when the price rose 25% relative to the distance from the Stop Loss, I set the breakeven. Adjusting very aggressively
[11:11] simply to avoid losing money, this has one positive point, which I'll explain first, and several negative points, which I'll explain second. The operation as volatile as scalping, it avoided many losses since as soon as
[11:26] the price moved in his favor, he set the breakeven and didn't lose anymore. The negative points are that he had to be in front of the screen for many hours; he had to perfectly master the strategy. Many times the price would fall a little or
[11:39] move against him, but then it would quickly continue, and he wasn't in the position. And finally, not only did he have high profitability with risks less than one, as we've seen in the example, but he also had to execute many
[11:53] trades. Now, how do we solve this? Well, in the When executing the entry, what we're going to do is place the Stop Loss in its correct position, and we'll always set the Take Profit at a risk-reward ratio of 1.5. This way,
[12:07] we ensure that the return is higher, or failing that, we'll exit the position when the price breaks the 50-period moving average, indicating that the short-term trend has ended. This allows you to do two things: First, with
[12:22] a risk-reward ratio of 1.5, you don't need such a high win rate; and second, by not being so aggressive with position management, you avoid having to not being so aggressive with position management, you avoid having to
[12:39] entry and exit positions due to the inherent volatility of scalping. As a final comment, the risk per trade cannot be 1%; it has to be lower. This person set it at be lower. This person set it at 0.50. I think it's the right thing to do, but only if you've already
[12:51] strategy. For anyone starting out in scalping or wanting to test this strategy, remember to always start in a demo account first. You should always start in a demo account first. You should risk 0.25%
[13:05] the first pinned comment and in the description of this video, you'll find various links to courses, tutorials, guides, training, and other trading strategies—all 100% free content so you can continue learning
[13:19] as a trader without investing your own money. I'll leave this video helpful, which is the important thing. If so, please like, subscribe, and share it with friends and family. See you in the next video!


⚡ Saved you 0h 13m reading this? Transcribe any YouTube video for free — no signup needed.