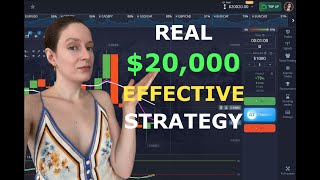

The Secret Setup: 3 Indicators for Any Market
45sReveals a simple yet powerful indicator combo that works in any market, appealing to traders seeking reliable strategies.
▶ Play Clip"The title promises $20,000 profit, but the video only shows four small wins without any profit figures — classic overselling."
This video presents a trading strategy for the Pocket Option platform, combining Japanese candlesticks, two moving averages (periods 5 and 8), and a stochastic oscillator (13, 2, 2). The trader demonstrates the method through several live trades, emphasizing the importance of indicator crossovers and trend direction for entry signals.
The strategy uses Japanese candlesticks, two moving averages (period 5, pink; period 8, white), and a stochastic oscillator with periods 13, 2, 2. The trader emphasizes that the method works in any market volatility.
The primary signal is the crossing of stochastic oscillator lines and their subsequent direction. The moving averages should also cross in the same direction. An uptrend is a strengthening factor but not strictly necessary.
The trader opens a downward position when stochastic lines cross and move down, with moving averages crossing in parallel. Despite no clear downtrend, the signals are considered strong enough to enter.
The trader notes a standard situation with both indicators crossing. He acknowledges the risk due to a downward trend but trusts the indicators and candle patterns, predicting a reversal after four green candles.
The ideal scenario includes a clear downtrend, a large red candle indicating strong selling, and both indicators crossing. This combination suggests high probability of continued downward movement.
The trader reports four wins out of four trades, highlighting the method's simplicity and effectiveness. He attributes success to careful observation of both indicators and candles.
The strategy relies on confluence between stochastic and moving average crossovers, with trend and candle patterns as additional confirmation. The trader claims a 100% win rate in the demonstrated session, but warns of risk when trend is absent.
What are the periods of the two moving averages used in this strategy?
5 (pink) and 8 (white).
00:31
What are the periods of the stochastic oscillator?
13, 2, 2.
01:02
What is the primary signal for entering a trade?
The crossing of stochastic oscillator lines and their subsequent direction.
02:03
What additional factor strengthens the signal?
An uptrend (or downtrend) in the market.
02:19
What does a large red candle indicate in this strategy?
Strong selling, suggesting that the next few candles will likely be red.
05:04
Indicator Confluence
The core principle is that multiple indicators must align, which is a common but effective trading technique.
02:03Ideal Setup
The trader clearly defines the best conditions for high-probability trades, which is actionable for viewers.
04:49Claimed Win Rate
The trader reports 4 wins out of 4 trades, but this is a small sample size and should be viewed with caution.
05:27[00:00] Hello friends today I will try to show you all the details that make this strategy so so effective and easy to use in any trading session. for this method it
[00:16] doesn't matter how volatile the market is. it's still quite effective if used correctly. first of all, I start setting up the first indicator and
[00:31] it is not indicator. it's Japanese candles. then I set up two moving averages and a stochastic oscillator. the periods of the first moving average is
[00:46] five and color is pink. the period of the second moving average is 8.
[01:02] color is white and keep it. next is the stochastic oscillator with periods on 13 2 2. let's change all the colors and make each line
[01:19] bold. as always, I choose the best currency pairs with best percentage and most importantly this method
[01:33] Works in any market and is a fairly simple method if a Trader uses it correctly. so, I need some time to find a great moment and get back to you. friends, I want to remind you that for all those
[01:50] who are interested the platform registration link is in the description of the video. in this strategy I pay the main attention to the line of the stochastic oscillator and in which
[02:03] Direction they move. but I take into account the fact that these lines must cross each other and then move in a specific direction. also, the pink and white lines of both moving averages should
[02:19] be crossed with them. the third factor that strengthens the signals more is the uptrend and this factor is not so necessary. but if there is an upward Trend when we open such a position
[02:38] it's a great signal. so, the first win is so good. I think it's another good moment.
[02:50] as you see, I'm opening a position in the downward Direction. I look at the stochastic oscillator lines crossing each other and going down. this is a very good signal. but I don't limit myself to this
[03:06] indicator and also, look at the pink and white lines of the moving average which also cross parallel to the lines of the stochastic oscillator and these are very good signals.
[03:22] unfortunately, I don't have a downward Trend here but I really like the signals from these two indicators. and that's why I decided to go into this trade and it's a little bit risky.
[03:39] and great! I fixed the second win. as you see, it is a standard situation. the lines of both indicators cross each other. personally, I would say that this is a
[03:59] little bit risky situation of this method since the specific Trend here is more down. but here I only trust the indicators. I also like the condition of the candles. four green
[04:16] candles were made in the upward Direction and I think there will be one more green candle and then the direction of the candles will go down. I think so. and as you can see, when green candle
[04:32] appeared.. cool! the third win was recorded. I think we have another cool moment and I want to tell you that this is the best
[04:49] situation of this method. of course, first of all as you know I observe the stochastic oscillator which gives me excellent signal and the lines of the moving average
[05:04] also cross each other. here we have two more main factors. first, we have a clear downtrend and that is great. at the other end there is strong selling or a big red candle. this
[05:27] means that the next few candles with indicator signals will most likely be red. for wins out of for trades. isn't it pretty cool? as I told, you can see that the red candles
[05:47] have continued to move in a downward Direction. I really like this method for its Simplicity and for its Effectiveness. you will also notice that I pay a lot of attention to both indicators and
[06:01] candles because they also tell a lot about the movements of a particular currency. I hope you enjoyed the video and don't forget to like And subscribe to the channel for more informative
[06:17] videos. also, please leave a comment how you like this method and if you tried it and what is like your results. I want to say goodbye. see you in the next video. thank you so much!




⚡ Saved you 0h 06m reading this? Transcribe any YouTube video for free — no signup needed.