
AI Summary
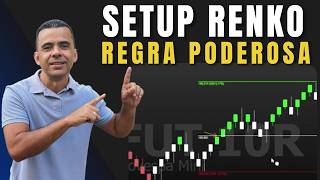
This video presents a Renko chart trading strategy for the Brazilian mini-index (WIN) using a moving average crossover model. The strategy employs three exponential moving averages (12-period based on high, 12-period based on low, and a 3-period based on close) to generate buy and sell signals. The presenter emphasizes a color-coded rule to visually identify entry points, with a risk-reward ratio of 1:1.5 or 1:2, and stresses the importance of trade management and discipline.
Chapters
The video introduces a moving average crossover study model for trading the mini-index, promising a different approach with a visual and objective color rule.
Use a 12-period exponential moving average based on the high, a 12-period based on the low, and a 3-period based on the closing price (crossover average). The crossover average crossing above the upper lane signals a buy, below the lower lane signals a sell.
The risk-reward ratio is set to 1:2, but can be 1:1.5. Suggested trading period is from 9 to 11 AM, but depends on the trader's management system.
Wait for the green moving average to cross the upper 12-period average for a buy, and cross the bottom for a sell. Observe at least two boxes after the intersection to confirm the signal.
A color rule is provided to make the chart clearer: white boxes neutralize the chart, green boxes indicate buy signals, red boxes indicate sell signals. Two consecutive boxes of the same color are required for entry.
Copy the code from the first comment, paste into the Profit strategy editor, set negative and positive boxes to white, then create a new coloring rule with the provided code.
When the market opens, there is often a direct move. Wait for white boxes to neutralize the chart, then look for two green or red boxes in sequence to signal entry.
Place a buy order above the second green box, stop loss at the last low, and target at 1.5 times the risk. Use the risk-reward tool to visualize.
Once the trade moves halfway to the target, move the stop loss to breakeven (zero) to protect the trade. Consider taking partial profits if trading multiple contracts.
These setups often result in long-term moves, so it's typically one trade per day. After hitting the target, wait for the next signal.
Two red boxes signal a sell order. Place stop loss at the last peak, target down. Manage the trade by moving stop to breakeven when halfway.
If trading two contracts, take partial profit when the trade moves more than half the target, deliver one contract, and protect the other with a stop at breakeven.
When the trade hits a support level and moves halfway, adjust the stop to entry point to avoid losses. If multiple contracts, take partial profits.
If the stop loss becomes too long (e.g., 340 points), it's important to manage risk carefully. Move stop to breakeven when halfway to target.
The presenter encourages viewers to test the model, apply the rules, and share their opinions. He also mentions other videos that may help.
The strategy relies on a clear color-coded rule for entry signals on Renko charts, with a focus on strict trade management to protect profits and minimize losses. The presenter emphasizes discipline and suggests that this model can be effective for day trading the mini-index.
Mentioned in this Video
Tutorial Checklist
Study Flashcards (10)
What are the three moving averages used in this strategy?
easy
Click to reveal answer
What are the three moving averages used in this strategy?
12-period EMA based on high, 12-period EMA based on low, and 3-period EMA based on close.
01:02
What is the suggested risk-reward ratio?
easy
Click to reveal answer
What is the suggested risk-reward ratio?
1:2, but can be 1:1.5.
01:40
What does a green box indicate in the color rule?
medium
Click to reveal answer
What does a green box indicate in the color rule?
A potential buy signal, but two consecutive green boxes are needed for entry.
06:30
How many boxes are required to confirm an entry signal?
medium
Click to reveal answer
How many boxes are required to confirm an entry signal?
Two consecutive boxes of the same color (green for buy, red for sell).
06:45
Where is the stop loss placed for a buy order?
easy
Click to reveal answer
Where is the stop loss placed for a buy order?
At the last low.
07:11
What is the target price for a trade?
medium
Click to reveal answer
What is the target price for a trade?
1.5 times the risk (or 2 times if using 1:2 ratio).
07:43
When should the stop loss be moved to breakeven?
medium
Click to reveal answer
When should the stop loss be moved to breakeven?
When the trade moves halfway to the target.
08:09
What is the suggested trading period?
easy
Click to reveal answer
What is the suggested trading period?
From 9 to 11 in the morning.
01:53
What does a red box indicate?
medium
Click to reveal answer
What does a red box indicate?
A potential sell signal, but two consecutive red boxes are needed for entry.
09:49
What is the purpose of the color rule?
medium
Click to reveal answer
What is the purpose of the color rule?
To make the chart clearer by neutralizing white boxes and highlighting green/red signals.
03:59
💡 Key Takeaways
Three Moving Averages
Defines the exact indicators needed for the strategy, making it replicable.
01:02Color-Coded Entry Rule
Provides a visual, objective method to identify entry points, reducing ambiguity.
03:17Management to Breakeven
Emphasizes protecting capital by moving stop loss to breakeven at halfway, a key risk management principle.
08:09Partial Profits
Suggests taking partial profits to lock in gains while letting the rest run, a common professional technique.
11:04Avoiding Long Stops
Highlights the danger of wide stop losses and the importance of managing risk.
12:59Full Transcript
[00:03] operational model for you to be trading mini- index. I'm going to talk about the moving average crossover study model in a very different way, but with an begin speaking, I invite you to subscribe to this channel. Turn on notifications
[00:19] to receive updates and, of course, if you like it, I'd love for you to leave a thumbs up to encourage our work. And also comment, I want to know your opinion on whether this study will actually contribute to
[00:33] opinion. Now I'm going to go to my screen and show you how to prepare the chart. I'm going to give you an extremely visual and objective color rule for this operation. So let's go over to my screen so
[00:48] I can show you all of this. So we're already here at the graph. I'm going to share with you everything we need to apply this operational model to the apply this operational model to the Renco 10R mini-index chart. So
[01:02] , what do I need to use here? A 12-period exponential moving average based on the high. We have a 12-period moving average based
[01:14] a 12-period moving average based on the low and a three-period exponential moving average based on the closing price, which will be the crossover average. So, when she crosses the upper lane, we'll have a purchase. When
[01:26] she crosses the lower lane, we'll have a sale. The 10R chart is used, but nothing prevents sale. The 10R chart is used, but nothing prevents you from actually testing at other time points. The risk-reward ratio I put here is
[01:40] The risk-reward ratio I put here is one to two, but it will be one to one to two, but it will be one to one and a half, one and a half times the risk. The one and a half, one and a half times the risk. The suggested operating period is from 9
[01:53] to 11 in the morning, but that depends a lot on the management system you're going to set up here. It's just a suggestion. It's important to maintain discipline with the rules we're going to present here, and taking great care with management is the secret to
[02:07] achieving success in day trading, especially with this model. And what are the moves I want to capture? I said it would be a crossover between averages, but a slightly different kind of crossover. I believe you
[02:21] haven't heard of it, but testing it here, I saw that it gives a really great result. Taking this as the market opens, where should I look for a trade? When I see a moving average crossover, where this green moving average
[02:36] average crossover, where this green moving average crosses over the upper 12-period moving average here, I'll have a buy position. When it crosses the bottom, I'll be in a good position to sell. How do I access the transaction
[02:51] here? I'll wait for this crossing movement here. I'll observe the box. who made the crossing. And I'll be watching at least two boxes after the
[03:03] intersection. It's a little tricky to see here, but here's the secret. I'm going to give you a color-coded rule in a little while that will show you exactly which stall you need to enter. For example, here I
[03:17] have the box here, it came out in the color I want. I'll tell you the first one that stayed. With the second one that remains, I'll put an order right above it. For example, I'll use this as an example for you here.
[03:30] movement, he worked here inside the canal and he came to this point and made the crossing. He crossed. Imagine this is my signal box. From there, I
[03:42] 'll place my entry at that point, my stop at that last low, and my projected target one and a half times upwards at the green line. And it hit my target up there . The objective, the idea behind the operation, is this: But to avoid this
[03:59] coloring rule that will show the graph in the cleanest and clearest way possible . So here I have a cleaner chart, where I have exactly the entry signal here, the target at the top, and
[04:13] the stop down here. How do I make my chart look like this? With the rule that I'm about to give you. All the code for this rule will be in the first comment of the video. So, copy the entire rule and paste it here
[04:26] into the Profit strategy editor . You'll have this rule there. First, you'll select this, go to properties, to properties, and in appearance, you'll set
[04:40] the negative boxes to white, the positive boxes to white, everything white here. When you select it, it becomes all white, which makes it easier for us to apply our coloring rule. To do
[04:54] this, we're going to create our own rule. Go to strategy, then to strategy, then strategy editor, new strategy, coloring, and click OK. He will deliver it to you here
[05:07] here with the code already selected. You're not going to use this code; you're going to delete all of this code. Copy the code I left in the comment, come here, and paste all of it. This is the
[05:21] color code we're going to use. Go to the floppy disk, save it, and give it a name here. I am using the term "cross average rule". Then you can
[05:33] use whatever name you want. I recommend this one, it's easier, okay? Enter the name; copy it so it will be easier for us to search for it later when we apply. Then from there, just click save. Now, here on the graph,
[05:45] right-click on any of the boxes. Click here to insert a coloring rule, go to the plus sign below, and enter the name of the rule you created in the search bar.
[06:01] Average cross rule, it already appears. Select it, click here to insert. Very good. Cut out the applied coloring, ready-made chart. Here's a very important piece of information to share: when Far has an opening in the Renko chart,
[06:17] he usually makes a direct move. What are we waiting for to pursue the operation? Depending on how we open it, we'll need boxes in white, to neutralize my graphic. And from there I will
[06:30] pursue the operation. When will I have the surgery? When I receive boxes in green or red, it signals a buy or sell order; one box isn't enough , I need two. I'm going to have one box set in sequence, two in sequence,
[06:45] so that we can have the possibility of purchasing them. So, for example, here, in this case, he came, left it red, came, left the box white, left it green. Green means nothing to me; I
[06:57] would need two to make a purchase. He went back to having white boxes, and here he gave me a sequence with two green ones. A sequence with two green lines. Here I have an entry order right above this one here, see. I visualized him. Bring some order
[07:11] here. How do I place my order here? I'm placing a buy order here. Where is my stop sign located? My stop loss will be at the last low, okay? So the closest low here is where my stop loss will be. In this case, let me pull it up
[07:27] so we can visualize it; I'm going to use the risk-reward tool here. So I have a buy order, a stop here at the low of the last low, right? A safety stop at this point and my target projected up there. In this case,
[07:43] it activates the entry, it makes the movement. Well, one thing we're going to observe a lot is that if you walk here, it's one and a half times. When he gets closer here, he'll have walked quite a bit here, depending on the score he walks. For example,
[07:57] here I have a stop loss or a target of 400 points. If this movement on the chart goes 250 to 300 points, I'll set my stop loss here at zero, a
[08:09] little above zero, protecting my trade. So it's good that we always pay attention So it's good that we always pay attention to this type of management. halfway point; look, he got halfway here. What do I do? I'll grab
[08:24] my stop loss, put it here at 0 to zero, three protected. From there, we just have to wait for the protected. From there, we just have to wait for the market to move. He's going up there
[08:38] will generally be trades with long-term movements. I made 400 points on this trade, what should I do today? Basically, with 400 points, there's right? So, it's good to be careful not to
[08:53] right? So, it's good to be careful not to expose yourself too much. Generally, these are setups where you have a two-to-one or 1.5 ratio, where the target becomes very long, it's one trade per day, one operation and you're happy to close it, okay? So in
[09:09] this case, the operation was successful, the trade was already protected, OK? We caught a good movement, a good trend. I hit the target there, what am I supposed to do next ? I need to wait to see it.
[09:23] Sorry, everyone. Sometimes I'll say candle box, but here at Renco it's always box, okay? So, out of habit, I might accidentally say "candle" here a few times, but it's always "box," okay? Oh, so I have a white box. From this
[09:36] point on, I can have green or red. I'll have the operation activated from then on, see? White box. White. I have a green one here. I'll make
[09:49] green ones to be eligible for entry. There are no two green lights, nothing to be done. I have one red one, I have two red ones. With two red lights, I have a sell order here at this point. The stop loss is placed at the last peak, and the target is set
[10:05] down here. It activates, it makes the movement. Look, he came, he walked more than half of this way, right? Here I could already protect the trade, it's up to me Here I could already protect the trade, it's up to me , but I could protect it.
[10:19] point. What do I do? The stop signal comes here, at 0 to 0. If he comes back, it's a trade I won't miss again, okay? So it's important to pay attention because this trade alone has a target of 380 points. He's already moved at least 200 points
[10:34] here. Therefore, you cannot place a stop-loss order on a trade that has already moved more than half of its target price. In this case, it moves. Look In this case, it moves. Look , he's back at square one. Here's
[10:49] something interesting you can do. I'm trading with two mini contracts. It's reached more than half of my target here, take a partial profit, deliver a contract, leave the stop here, an operation where you won't lose anymore and
[11:04] you've already pocketed the profit. Then, if my stop loss is here, I exit the trade, the trade is closed, my original stop loss was up there , moving forward, I come here and exit the trade. If I only have one
[11:19] contract and I also want to protect it, I'll exit the operation. There is nothing to be done. We'll wrap things up here with a profit in our pockets. It's important. That's what I said, focus on management. From that point on, I had a green light here
[11:33] that it would be a purchase. One alone is not enough. Here I have two red boxes. I'll make the entrance. Keep in mind that I made a huge profit at the beginning, and here we're basically breaking even . So there would be an operation
[11:47] . So there would be an operation here. Yes. Entrance. The stop loss is placed at the high, the target price is down here,
[11:59] , he activates the operation, makes the movement activates the operation, makes the movement there, gets locked, stays quite sideways, right? It's there, gets locked, stays quite sideways, right? It's important to note here that he's at
[12:12] a support point. He passed him, passed him, he's already hit half of my target. What am I supposed to do here? Management, stop, go down, I'm coming here? Management, stop, go down, I'm coming here to the entry point, I'm
[12:26] not losing anymore in the operation and I'm looking for profit. If I have more than one contract, it's time to make a partial payment, put it in your pocket, and protect it up there. Oh, he's coming back now. If I did it partially, I'll put it in. If I have a
[12:43] contract, and I lower the stop-loss order for protection, I also exit the trade. Very good. Here, after that movement, a new signal with two boxes in green. So, I have a ticket. The problem here is the risk, you see. Prohibited. The stop loss became
[12:59] extremely long. A stop loss of 340 points. the target projected up there. So, once again , it's time to work with management.
[13:11] Entry activated, movement completed. He's gone more than halfway, stop, climb up, come here for protection. If you have more than one contract, make a partial payment; otherwise, protect yourself here and observe market movements.
[13:33] fully completed. The important thing is to manage and protect your trade.
[13:46] you held on. Let's see how far
[13:59] also a possibility of getting a good deal at that point. That's it. I told you this model was really cool. Now it's up to you to run your tests, organize your chart, apply everything I've told you, and see if it really
[14:14] any way, I'm already immensely happy. And all I ask is that you activate the bell to receive notifications, and comment: "I want to know your opinion." I am immensely grateful for you staying with me for this
[14:29] video. Until next time. Oh, and don't forget, there are two other videos right here look there, I think it will help you a lot too. Warm regards to help you a lot too. Warm regards to all. God blesses. Very.



