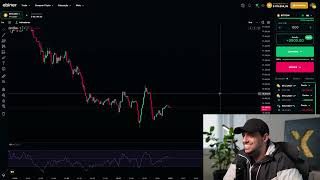

I Tried to Turn $1000 into $8000 in 3 Trades
45sThe high-stakes challenge of tripling money through risky options trading immediately grabs attention, appealing to viewers' curiosity about get-rich-quick schemes.
▶ Play Clip"Delivers exactly what it promises: an uncut, real trading session with losses and wins, though it's padded with long waits and self-promotion."
In this uncut, real-time trading session, a professional trader attempts to leverage $1,000 into $8,000 through a series of binary options trades on Bitcoin and other cryptocurrencies. The video documents the entire process, including analysis, entries, losses, and the final outcome, emphasizing the importance of patience, confluence, and risk management.
The trader aims to leverage $1,000 using options trading, with a goal of three consecutive wins to multiply the amount. He mentions previous successful sessions and invites viewers to join his Telegram group and free course.
The trader analyzes Bitcoin's downward movement, using Fibonacci retracement levels and volume profile to identify potential entry points. He notes a confluence at the 61% retracement and a rounded price region around $76,800.
The trader places his first trade of $1,000, planning three attempts total. He explains the 'Soros' method of compounding interest, aiming for a 3-0 win streak.
The first trade results in a loss, but the trader remains confident in the price region, citing strong confluence and win rate. He decides to try again in the same area.
The trader reflects on how a good analysis can still result in a loss, but emphasizes that following the plan is crucial. He notes that deviating from the plan and winning can lead to bad habits.
Bitcoin is moving sideways, which is common after strong upward movements, especially on Fridays. The trader waits for a clear opportunity, highlighting the importance of patience.
The trader identifies a confluence between the POC (Point of Control) and the 38% Fibonacci level, and later the 78.6% level with an HVN (High Volume Node), as potential entry points.
The trader stresses that amateur traders lack patience and often make bad trades. He advises waiting for opportunities that align with your strategy, even if it means not trading.
The trader spots a diamond pattern on Bitcoin, a reversal pattern that could indicate an upward movement. He notes the need for confirmation, such as a breakout above a previous high.
The trader examines Ethereum and Solana, noting potential resistance zones and the importance of confluence. He decides to wait for better setups.
The trader briefly checks Dogecoin and other assets, but finds no strong setups. He emphasizes the importance of waiting for high-probability trades.
The second trade also results in a loss. The trader remains calm, noting that the analysis was correct but the trade didn't work out. He prepares for the final attempt.
The trader identifies a strong confluence for a buy entry: a breakout above a previous high, a diamond pattern, and a Fibonacci retracement level. He places his final trade of $4,000.
The final trade also ends in a loss, resulting in a total loss of $3,400 for the day. However, the trader notes that his monthly profit remains positive at $16,500.
The video concludes with the trader accepting the loss and emphasizing the reality of trading: not every trade will be a winner. He encourages viewers to join his free course and Telegram group for live sessions, and reminds them that discipline and patience are key to long-term success.
What is the 'Soros' method mentioned in the video?
It's a compounding method where you reinvest profits to increase position size, aiming for a 3-0 win streak.
03:55
What is the POC (Point of Control) in volume profile?
It's the price level with the highest concentration of volume, often acting as support or resistance.
08:55
What is an HVN (High Volume Node)?
A region on the volume profile that concentrates a significant amount of volume, making it a potential area of interest for trading.
08:55
Why does the trader avoid trading in sideways markets?
Because there is too much noise and false breakouts, making it difficult to get reliable signals.
09:35
What is the diamond pattern?
A chart pattern that indicates a potential trend reversal, often after a downtrend, suggesting an upward movement.
12:34
What is the trader's monthly profit after the loss?
He is still positive at $16,500 for the month.
36:20
Patience is key
The trader emphasizes that waiting for the right opportunity is crucial, and that impatience leads to bad trades.
10:06Diamond pattern analysis
He identifies a rare chart pattern and explains its significance, showing his analytical approach.
12:22Accepting losses
The trader openly shows a losing trade, reinforcing the reality that not every trade is a win.
34:03[00:02] Today I'm going to try to leverage $000 by trading options. And this month I've already done two live leverage sessions at 8 PM, and hundreds of people watched and profited along with me. Best of all, they learned. Those who
[00:16] following my live streams, you need to be in the groups and follow the links in the you can create an account with the brokerage. It's in the description. Take a look later, I also have a free course. But without further ado, let's get straight to the
[00:31] leverage. As I said, two leverage attempts this month were successful, but unfortunately the leverage attempt I tried yesterday didn't work. So, in two leveraged trades I earned over $5,000 in each one,
[00:44] I earned over $5,000 in each one, meaning over $10,000 in profit. However, yesterday was a day of losing 3,000. So, on average we're showing a profit of 6,000 to 7,000 , a positive result even with leverage. in the month of May. And now I'm
[00:59] going to try to make one more, okay? And I'm going to share it with you uncut, unedited share it with you uncut, unedited . This is a real video. You are observing a real leverage session with a
[01:13] real account, at a real broker, with real results, whether positive or negative. Let's see what my result will be, okay? So, the
[01:25] first thing I'm going to look at here on the Bitcoin chart is that we were in a very interesting movement, a really nice downward movement, where I really like to trade using Fibonacci, having some kind of
[01:40] confluence, right? And if the market starts to go up, we'll very to go up, we'll very likely be able to close the trade at the 50% Fibonacci level here at 61 as well. We'll see, we'll see. I'll improve this analysis
[01:54] later, because here it's just a possibility that we might see an upward trend movement. There are other scenarios, okay? Here we There are other scenarios, okay? Here we had a region that, if it receives another
[02:06] had a region that, if it receives another attack, I will consider it a region of resistance. So I need to wait for another signal here before maybe even going short, okay? In this price range, but we
[02:19] still have to wait for the very short term, let's do the following: let's take a let's do the following: let's take a look at the concentration of operations in this period here, during this sideways movement, after this downward impulse
[02:33] . The point with the highest concentration of orders, which is our volume profile indicator, is precisely here in this price range. Looking at the very short term, we might even
[02:47] find an opportunity trigger here, an entry point, okay? convergence, right? So here we have the control point, and the price is hitting
[02:59] the 61-period Fibonacci retracement level, which is a very good region to enter a short position. So, whether we like it or not, we have a confluence that isn't very good at this point, but it's an interesting confluence, considering that it's a win rate here
[03:13] at 76,800, which is a rounded price region. So this is a valid point to consider when making a sale, okay? So, I believe I'll take my first entry, my first attempt
[03:26] here at leverage, an entry of $000, and I'll have three attempts. I'll bet $000, if I lose, I'll try again. If it fails, I'll try again. And if I lose all three attempts, that's it . Beauty? So, I'm carrying out
[03:40] . Beauty? So, I'm carrying out my operations here in an attempt to leverage these 1,000. And I want to get three entries in a row, okay? So I want to get three wins in a row. I'll contribute $. 1,000, if
[03:55] and if I make a profit then I'll bet 4,000. I need to win 3-0. So I have three attempts to get 3x0 using compound interest, with what many know compound interest, with what many know as the "Soros" method, right? So let's go for it and
[04:10] see if it works out, right? Let's see if we can manage to reach if we can manage to reach this goal, this objective, okay? Then this goal, this objective, okay? Then we'll see what happens.
[04:28] Let's see. I'll be keeping an eye out and waiting, right? There's not much of a secret to it.
[04:45] my daughter. In the very end, you're not going to reverse it, are you? Oh, oh, oh. Wow, at the last second the sail flipped. She remained respectful the entire time.
[04:57] Mommy's daughter. Beauty. Our first attempt at leverage was unsuccessful, right? Well, that price range is still a very good price range, okay? A
[05:09] very interesting region to carry out the operation. Beauty? Given the win rate, as I mentioned, and because it's in the 61 range here, I can try to pick another trade here. Let's see if I can find another opportunity here, another
[05:23] another opportunity here, another possible entry point, okay? But if it's not possible entry point, okay? But if it's not available there, it could be a good option. again, everyone. I'm going to go back in here and sell again because it's a
[05:38] very strong price range. And that's something that many people who trade analyze it, we identify a region that is strong. Those who trade Forex or candle will hold or not. He's doing an analysis so that the movement as a whole
[05:54] analysis so that the movement as a whole ends up being respected, right? Well, it doesn't matter if a candle didn't respect the established pattern or anything, as long as the stop loss hasn't been triggered, life goes on. But not in the case of options. You need to pick the exact trigger. And
[06:06] sometimes you do a good analysis, a very interesting movement, several confluences, you take a trade and that trade ends up losing and wrong, but in fact sometimes your analysis was right, you just lost
[06:22] had another opportunity that you respected, okay? For example, I entered the trade, the candle held up really well, but at the very end it gave a loss. And you saw what following candle plummeted, meaning
[06:35] my analysis was correct because the candle I entered the trade on was performing very well, candle performed well too, and now I've entered again and it's performing very well, okay? So now we're finally going to succeed and
[06:49] pull off a winning operation. I'll take this small entry here with the profit and get ready for the second entry with $000. The correct way would be to enter with 1900, which is entering with 1000 plus the amount I profited in the previous operation. But to make it
[07:03] easier, I'll just double it there, because going from 100 to 2000 changes because going from 100 to 2000 changes practically nothing, right? So, uh, let's go for it . Let's find another opportunity. Remember that this video
[07:16] opportunity. Remember that this video won't be edited, so it might take a while to find an opportunity to get in, right? It might take a little while, we'll keep an eye on it, okay?
[07:29] And to understand what's going on in the market here. Bitcoin, well, it's within that lateral movement, right? It's
[07:41] very common for the market to move sideways for a while after strong upward movements, especially on a Friday, right? This is the price range we've entered, a very strong region, as I mentioned before, right? But
[07:57] mentioned before, right? But now we can even look at this upward momentum and seek a buy opportunity, okay? Because he's positioned laterally, I believe he'll remain within that lateral position.
[08:12] I just need to find some common ground here. So I'm going to pull the volume profile throughout this entire movement. Just look. So much, it even respected, look, 38. candle, the next candle went up and respected it, you see? And there was a confluence here between
[08:27] you see? And there was a confluence here between POC and the 38 region, right? Well, it's over now POC and the 38 region, right? Well, it's over now . 50% of Fibonacci does n't make sense to me. Here at channel 61, it's starting to pick up a little volume again, but it does
[08:42] n't make sense anyway. That would be an entry point more in the range of 78.6%. because we have a Fibonacci confluence along with this HVN, which, for
[08:55] those who don't know, is where the POC (Point of Contact) is where there's the highest concentration of volume when we plot the volume profile. But the HVN is the high volume node , which is a region here that also concentrates a significant amount of volume.
[09:08] So it's also very interesting for a potential operation. So, if the price gets here, I'm going to make a buy order, okay? Let's see if I can
[09:20] find any other opportunities around here. Well, here on Ethereum we might end up forming a long-term trendline (LTA),
[09:35] but when we have sideways movement like this , trading long-term or long-term trends isn't you're waiting for a breakout to trade a pullback. That's great. Now, no pullbacks, because there 's too much noise, too many false breakouts. So, it's not really worth it, okay
[09:50] ? Okay, let's keep an eye on Bitcoin, which at first glance Bitcoin, which at first glance seems to be the best asset to trade with, okay? So we just have to wait, right? Let's wait for the opportunity. One thing
[10:06] I often say is that amateur traders lack patience, so they try to hunt for opportunities. And it is precisely in these moments that he avoids
[10:18] management, he avoids the operational side. It's in moments like these that he makes a bad trade. A trader who knows what they're doing waits, patiently waits for an opportunity that aligns with what they've defined. Whether they'll
[10:33] enter in 10 minutes, 15 minutes, or even 20 minutes, and nothing happens, they might wait. But patience, life goes on, you understand? He's been waiting and hasn't had the opportunity. It's better to not trade,
[10:45] to stay at break-even and wait, so to speak , wasting time, than to , wasting time, than to immediately enter a position with the wrong outcome and lose money, you understand? Even if you win one day or another, being hasty and
[10:58] operating incorrectly is terrible. It's even worse. It's better to trade incorrectly and lose than to when you trade incorrectly and win, you automatically send a signal to your brain that when you deviate from the plan, it works, and then you become addicted to deviating
[11:13] from the plan. Now, if you deviate from the plan and take a loss, at least after 5 minutes you'll be pissed at yourself and blame yourself. You say something like: "Damn, I screwed up , I went off plan, I deserved to lose ." And then you control yourself and don't make the same mistake again
[11:25] ." And then you control yourself and don't make the same mistake again , you understand? So, uh, that 's it. You have to wait, you have to wait. There's not much to do. Here at Ethereum we have a nice LTB (long-distance transfer), but as I said, we're
[11:39] nice LTB (long-distance transfer), but as I said, we're in a sideways position. Entering solely based on a downtrend line, entering a pullback here, doesn't make much sense to me, does it? But I can leave the marked regions to
[11:55] marked regions to eventually trade on a breakout, or trade on a pullback with some confluence. So, the high-voltage, low-voltage, it should be taken as if it were the best thing since sliced bread
[12:08] , because the probability of having false rupture noise probability of having false rupture noise is high, okay? Here at IDX, do we have any opportunities to enter
[12:22] the Tiene market? No tiene Bitcoin que já tá numa lateralo aqui, lateralizando ainda ainda. He made a diamond pattern here, right? It's quite
[12:34] occurs, because it's not very common, especially in such a visible way, right? Look, it's a reversal pattern, okay? It was a price reversal pattern,
[12:46] and it was coming from a downtrend. So, it's a chart pattern that theoretically, after a downtrend, the market will accumulate and begin an downtrend, the market will accumulate and begin an upward movement. However, it
[13:00] 's obviously not just a chart that will determine: "Oh, the price will go up." It 's impossible that it won't go up, you understand? You observe this, and you say, "Okay, we have a 1% higher chance that it will go up." It needs to have a pattern breakout,
[13:14] it needs to have confirmation, it needs to surpass a previous high, it needs to have other signals so that you can predict a trend movement. Better than any kind of chart pattern, as I've already explained and will repeat, is
[13:29] of chart pattern, as I've already explained and will repeat, is understanding tops and bottoms, breakouts of highs and lows; it's better than anything else. Even if we break through this peak here, we're still
[13:41] within a sideways range, because the highest peak we've had so far was the previous one, right? But at least here, theoretically it could be an to get there. Let's see what happens. Right? The Ethereum is here,
[13:55] okay? And Bitcoin is here. Let's wait. No, no, there's no need to This Fibonacci retracement is gone too. I'm going to take her out of here. We're not going to use it anymore, okay? I'm not going to use it anymore, okay ? Ignore the break in this little
[14:10] yellow line, okay? The yellow line here, I'm not taking the LTB (Long-Term Traffic Law) into consideration, etc. This is just to establish the pattern here; it's the diamond shape. the pattern here; it's the diamond shape. Beauty? But this upward trend
[14:25] could indicate a few things. Buying pressure, repetition of green candles. We already know that there is a slight probability that the market will reverse from this So we end up having a bit of bias, taking into account this
[14:38] possible autistic movement. Here we have this previous peak that can be surpassed. If that previous peak is surpassed, in my view, the market should eventually look for that price range here , okay? So, uh, we
[14:56] expect a breakout here and maybe we can trade in favor of that upward movement, a flow trade, okay? It 's not a pullback entry with many converging factors, no, but a trade favoring a breakout from this high could
[15:12] be interesting considering the overall scenario. And this repetition of green candles, okay? So, uh, it's a valid entry point in my trading strategy, the way I operate. Yes. So, I can take advantage of an operation in favor of that
[15:27] movement. The problem is that the trigger will occur after the price surpasses that occur after the price surpasses that previous high, right? Nothing here on DX. Here at Ethereum we have LTB, which I mentioned,
[15:42] but nothing has happened yet, right? No, we're not just getting involved because of LTB. Let's wait here for some convergence, something, right? And Bitcoin is also moving more slowly in this candle. Let's wait. Like I
[15:58] said, I'm not going to cut it, so I'm going to get my phone here. I'll be able to use my get my phone here. I'll be able to use my phone without any problems.
[16:58] Oh, Ethereum is interesting, okay? Interesting Ethereum here, huh? Let's go to etheréum. He made a marubozu, a candle with no shadow on the
[17:11] bottom, a large candle, with selling power, okay? It went down there, than that previous movement, but as I said, lateral movement as a whole
[17:24] can have various noises in LTA and everything else. Well, if we see a continuation of this downward trend, it's possible to trade in favor of the selling pressure, which should push the price towards the 2115 range,
[17:38] okay? The problem is that it's already started to all come back. So, the next candle, or the next one or two after that, we have to break through this bottom again here break through this bottom again here to consider it a
[17:53] smart point, right, to... to make a sell. IDX is very sideways, Bitcoin is also very sideways . Remember that there are still two operations left, right? I have two more
[18:08] operations left, right? I have two more attempts, right? And I have two trades want to leverage this and get two winning trades in a row, one for $2,000 and then one for $4,000. And if I don't succeed, then I
[18:22] for $4,000. And if I don't succeed, then I 'll make another $000 attempt, right? We actually already made one attempt that didn't work, and we're on the second attempt now. If this doesn't work, we only have one more try, okay?
[18:46] wait. It's good that this type of video shows the truth, it shows the reality so you understand that there are times when you won't have anything to do, you'll have to
[19:01] wait, you'll have to look at the graph, you'll therapy, therapy, okay?
[19:20] other assets here. Let's see how Solana is doing . Everything is very lateral. Solana has some pretty good resistance up here. She's already graduated. It would be possible to make a
[19:32] sale. The point is that I like to operate with confluence, so we need to see if this is a region that has experienced confluence. It has happened, but it has already respected the 61 a few times here, but it's already progress, we already have a certain convergence.
[19:46] Ah, it's a win rate, 87 as well, very cool. cool. Okay, let's see if this movement generated a little something here. Ah, great. He's really rocking out up here , that's why he's getting
[19:59] so much respect. It's a strong region for sales. You can seize the next opportunity. Just one more here in this resistance zone in Solana. That's resistance zone in Solana. That's great. Okay. And the rest are still weak.
[20:13] Let's see. Riple, Ripple, Ripple, Riple. There's resistance there, but the one in Solana is prettier, man. No damage. Dodcoin.
[20:27] Dodcoin is quite different from other assets, isn't it?
[20:47] This range is interesting around the 61-point Fibonacci retracement is interesting around the 61-point Fibonacci retracement and up to this point. Ideally, the distance between point 61 and the POC, for example, would be as small as possible to create
[20:59] a virtually exact confluence of the two lines, one overlapping the far away, but the region itself is a strong region. And here at the 78.6%
[21:12] Fibonacci level, it's also interesting because we have this HVN here. because we have this HVN here. So that's very interesting too.
[21:24] We can keep an eye on things there, okay? We can keep an eye on things there, okay? Bitcoin is still trading very sideways, bad thing, okay? It doesn't end up being a bad thing. Do you know why?
[21:39] Because all sideways movement is accumulation, and this accumulation will eventually point. Just like now, he's started to imagine things going up here, and he's going to It has now surpassed the buying flow that I had mentioned to you.
[21:55] going to take the buyer's position here now, right? we need the next candle to be a green candle, right? This candle
[22:11] being green is good. I just don't want her to get as high up there as she's getting up n't want her to get so close because what I said would happen is already happening . I didn't want it to be so fast, did I? I wish that movement would happen on the
[22:25] next sail. And it's already happening, and a good part of the movement is underway now, but that's okay, there's still room for improvement. He arrived and then left. There's an image there so that the next candle rises higher and reaches
[22:40] more or less this point. Further up here . You can see that he perfectly respected the analysis. Oh, I analyzed it carefully here. Well, we just need the next candle to go up now. Come on, old lady. Come up,
[22:54] go up now. Come on, old lady. Come up, baby. Let's go. All this time waiting for a good entry point, a flow entry in favor of the breakout, but I didn't want that candle to have risen so much because it had already pulled a good part of the
[23:08] movement. Well, as you can see, the daughter of the candle-wielding mom is trying to give daughter of the candle-wielding mom is trying to give them $000 here, and maybe we them $000 here, and maybe we have some here for one last try, right?
[23:20] But let's see what happens. Beauty. Oh my God. It seems like it's already over, huh?
[23:54] defeat. And now let's go for the last attempt, okay? Let's go! Let's go! Let's see here.
[24:13] confluence of the POC, of all this accumulation, is exactly at this price, which is the confluence with 50% of Fibonacci. The number 38 converges with that
[24:25] break through. Just a reminder that even though we took a loss, the analysis exactly what I said happened. I just figured he could go up a little higher, but it's okay, he should still get there, right? So I'll wait
[24:41] here for the next possible entry. Beauty?
[24:54] assets. Oh, Bitcoin, Ethereum, I mean, Logicin rolling. Let's see here. Bitcoin. Come down, my son, come down. It's getting close to 50 here. You can pick up this
[25:08] close to 50 here. You can pick up this purchase. And that's really cool. And that would be the last attempt here at 38, which is good too, okay? This area around the 38th is too, okay? This area around the 38th is good. OK. That's where it begins, uh, where
[25:22] that previous peak is, right? and the 38th degree of Fibonacci. So, it's a confluence of events, even from a video is a very interesting trigger for all markets, but I prefer, as this
[25:34] is the last attempt, to wait for the price to get down here before executing the trade. Okay, it's getting close, it's practically going to hit. Let's see, let's see. Maybe it'll only be on the next candle, huh?
[25:49] Maybe it'll only be on the next candle, huh? We'll see. It didn't hit now. Great, now that buy my things without worry. One last attempt at leverage, using a trigger that I really like , okay? And here it's very well aligned
[26:04] because we had the breakout, right, upwards from this movement, making this upward pivot. We also have the diamond pattern in the chart, which indicates a trend reversal. So it turns out that we
[26:18] have a very good possibility of the market continuing in favor of this upward movement, and the entry trigger was really good, okay? So this is a
[26:31] final attempt at leverage, which is 100% in line with how I like to trade, 100% in line with how I've been trading and profiting in
[26:44] recent months since the beginning of last year, trading live, practically all trades done live with sensational results, a sensational results, a net profit of more than 150,000,
[26:58] okay? And if you want to trade with me live, I'm trading around 8 PM Brasília time, which is 8 PM. All you have to do is join the Telegram group that's in the description of this video. And you
[27:13] can also become a student of Binary Class, which is my 100% free course, teaching you everything, everything, everything, everything from beginner to advanced so you can start trading, okay? So, I recommend that you use the links in the description of
[27:29] . If you've made it this far , if you're a patient person who wants to learn and truly make a living from trading, you're already people, just by watching until the end of the video. So, keeping that in
[27:43] mind, I recommend that you become my student for free and join the Telegram group for live sessions, okay? There you go, profit in your pocket. Let's move on to the next 2,000. OK. And for those who follow the live streams, you know
[28:00] that when I get to the third attempt at leverage, I often end up looking for flow or trend trades, which are trades that have a slightly lower success rate, they
[28:15] are less filtered, but for those who are going to leverage, especially in a last-ditch scenario, it's in a last-ditch scenario, it's interesting because if you catch
[28:28] a sequential movement, you can quickly hit your 3-0 . It's like if I had identified this movement by saying, " Oh, we'll have three green candles, it's an interesting region." Oh, I hit the
[28:43] trigger and three green candles came out of the trigger , see? So, I could have said green, green, green, victory, victory, victory, it's over, you understand? But obviously it's not that simple, right? So, if I find an
[28:56] opportunity to trade the flow here, I'm obviously going to trade it. But calm down, okay? Let's see if we'll actually have that
[29:09] Let's see if we'll actually have that opportunity. almost 30 minutes have passed in this trading session and you can see
[29:23] that the calm remains. Wait and make an calm remains. Wait and make an intelligent decision, okay? intelligent decision, okay? Solana almost made it to the resistance,
[29:37] but she came back here again, okay? We might find might find some movement here.
[29:52] She's holding her own at this price point. Let me see where the concentration is. Oh,
[30:08] . What's happening? The point of What's happening? The point of control region of the POC (Point of Concept) is where the price very commonly moves. Within a laterality. Theoretically, it's
[30:23] price, which is where the greatest concentration of volume in the past. Theoretically, it will continue to have this for a while. So, if the price breaks through this uptrend line, or uptrend line retracement, as I said,
[30:37] I won't trade in a sideways market, but the breakout, depending on how it happens, could generate a sequence of red candles, causing the price to fall to this point to seek liquidity before rising, right? Or even
[30:51] Regardless of what happens next, I just need to be sure that if he breaks through the CLTA, he'll come this way, and then I'll short sell believing that, right? sell believing that, right? Let's see if that's what happens. Look
[31:05] at Bitcoin. Bitcoin is finally reaching that peak I was expecting. And here there will be an opportunity for flow because it surpassed that previous high, even though it's in a more or less resistant range, right?
[31:19] I wouldn't consider it resistance, but it's a peak. He climbed all the way up here with that sequence of green candles, right? So, for me, this is quite interesting for carrying out a purchase transaction. The only problem is that I need a
[31:33] red candle now, a slight exhaustion in the price to trigger an entry, okay? So I'm going to wait a little bit here, I'm not going to take it into
[31:45] this peak, because I'm observing this movement itself, making ascending peaks and troughs, going up, breaking the previous peak. So here, just like this red candle. If this candle is a red candle, it'll really start falling nicely
[31:58] here, right? As soon as it drops a little, I 'll wait to enter because I want to sure it's a red candle, and then I'll buy it, you understand? Okay? So then I'm buying into the idea that it will be in favor of the continuation of this
[32:13] movement, okay? So, for now, everything's great here, things are happening exactly as I wanted. Let me zoom in here so we can see this opportunity from a different perspective , okay? So, I know
[32:25] I've removed the tools, etc., but it 's not an unsubstantiated entry by any means. Quite the opposite. We've been waiting here for many minutes to make a decision, to get the ticket, okay? She started to recover well.
[32:39] now. It's possible it might end up closing green, right? I hope it closing green, right? I hope it closes in red, okay? indicator, everyone? Because we experienced an exhaustion of the upward movement. Oh, the
[32:53] up, up. Exhaustion of the upward movement. But at the very end of the candle, br, the buying force returned. The shadow at the bottom indicates that there was
[33:06] was at the very end of the candle. So, it was great, okay? Because the sail has finished, great, okay? Because the sail has finished, returning this movement must continue. OK. That's what's happening. Let's see if it ends the way we
[33:20] expect, right? We'll see. Oh old lady, don't fall , my daughter. Oh man, just because it was going up 20 seconds left. Are you trying to lose money? Let's go, let's go. Also, remember,
[33:34] if we're going to talk about it practically, you don't need to be celebrating, you this to provide some entertainment here, so we're not just staring at the candle. And this won't affect me, it won't change my decisions because of this
[33:48] support I have. But you absolutely can't be a fan because you're still in the rooting for someone, it means you're focusing too much on the outcome, okay? So, there you go, profit in your pocket. It was difficult, but it came. And now for the last
[34:03] difficult, but it came. And now for the last entry, 4,000, okay? Buyer transaction. Beauty. I'm going to check Bitcoin again here , okay? Purchase operation. Why? Because the analysis remains the same. The market came, then it exhausted itself. Oh,
[34:18] this movement here is actually great, this movement is excellent, because it needs to have rising. He was already exhausted, he went back there, went upstairs, and kind of resisted, you know? But it 's still an analysis indicating an upward trend. And as I said, when it
[34:32] comes to the last leverage attempt, it's even good to try a repetition of candles, a flow, to trade in favor of the flow. And this movement is sensational. Even though the entry point is here, it will only open on the next candle, and it's
[34:45] as if I've overcome the pullback at this top, which would be the most interesting scenario possible, the best possible trigger in this situation. So, what's happening is exactly what I wanted to happen. And the candle started
[34:58] slapping me in the face, falling and trying to knock that son of a trying to knock that son of a [ __ ] down. Yes, there are 45 seconds left and we can [ __ ] down. Yes, there are 45 seconds left and we can
[35:14] still finish with a positive result. Right? So let's wait and see. The problem is that it's... well, it's something. Things are getting heated here, huh. Oh dear, oh dear, oh dear. Things are getting heated here.
[35:33] Come up, baby. Oh, oh, oh, oh, oh. Is this the last attempt, the final entry? We will not have victory, folks.
[35:47] Looks like it's going to be a defeat, huh? Damn. losing operation. Three attempts, we almost succeeded on the last try,
[36:03] almost succeeded on the last try, but the loss was approximately but the loss was approximately 3,000, okay? So, 3,000, okay? So, unfortunately it
[36:20] remains positive for the month. Look, I'm going to show you my results for today. -3,400. show you my results for today. -3,400. However, since the beginning of the month, 16,500 positive. And I'll end this video this
[36:36] way, showing you the reality of trading. Yes, ending with a loss. The leverage didn't work, and that's okay. Yeah.



⚡ Saved you 0h 36m reading this? Transcribe any YouTube video for free — no signup needed.