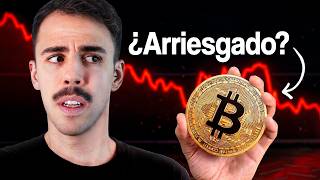

Bitcoin's Hidden Third Option
45sReveals a rarely discussed market scenario that creates curiosity and tension, perfect for hooking viewers.
▶ Play Clip"The title promises a decision framework for buying Bitcoin in 2026, and the video delivers exactly that with data and strategy."
The video analyzes Bitcoin's current sideways market movement, arguing that such phases often precede major price moves. It examines three on-chain and sentiment indicators to determine whether Bitcoin is approaching a market bottom or could fall further, and recommends a dollar-cost averaging strategy for investors.
Markets can go up, down, or sideways. Sideways movement is psychologically exhausting and often precedes a big move, typically a crash.
Sideways markets wear down investors through boredom and doubt, causing them to lose conviction and stop paying attention, which sets the stage for accumulation.
Major bottoms are not single candles but a process: sharp drop, rebound, further decline, then a prolonged sideways phase of apathy and boredom.
After the 2017 euphoria, Bitcoin fell throughout 2018, reaching $3,200 in December. Sentiment turned to embarrassment and disinterest, typical of a bottom.
Bitcoin fell from $69,000 to $16,000 after FTX collapse. The European Central Bank declared the sector dead, and retail interest vanished.
Great buying opportunities occur when fear and confusion dominate, not when everything is clear. By the time it's obvious, prices are much higher.
Bitcoin is around $70,000. The market is neither euphoric nor panicked, creating uncertainty whether this is a pause before further decline or an accumulation zone.
Major bottoms coincide with extreme fear. When everyone expects further decline, most sellers have already exited, reducing downward pressure.
Near bottoms, the percentage of Bitcoin held by long-term holders is at its highest, indicating coins have moved from weak to strong hands, reducing selling pressure.
Capitulation involves rapid price drops, huge liquidations, and volume spikes. It often marks the end of downtrends, as seen in March 2020, June 2022, and late 2018.
Instead of trying to time the exact bottom, DCA involves splitting capital into multiple purchases over time. This reduces risk of missing the bottom or buying too early.
If Bitcoin falls to $50,000–$55,000, those prices would be historically interesting. DCA allows participation even if the market rebounds sooner.
Buyers in 2018, 2020, and 2022 all feared total collapse, yet those were excellent opportunities. The key is patience and understanding cycles.
Bitcoin's sideways movement is a typical precursor to a major move. While further declines are possible, the combination of extreme fear, high long-term holder supply, and potential capitulation suggests we may be approaching a significant accumulation zone. A dollar-cost averaging strategy is recommended over trying to time the exact bottom.
What are the three possible market movements mentioned?
Up, down, or sideways.
00:01
Why are sideways markets psychologically difficult for investors?
They cause exhaustion, doubt, and loss of conviction, wearing down patience.
02:01
What pattern do major Bitcoin bottoms typically follow?
Sharp drop, rebound, further decline, then a prolonged sideways phase of apathy.
03:08
What was Bitcoin's approximate low in December 2018?
Around $3,200.
04:02
What was Bitcoin's all-time high in November 2021?
$69,000.
04:43
What did the European Central Bank say about Bitcoin in 2022?
They described the period noting Bitcoin had fallen from $69,000 to $17,000 and then fluctuated around $20,000 before falling below $16,000 after FTX collapse.
05:11
What is the Fear and Greed Index used for?
It measures market sentiment; extreme fear often coincides with market bottoms.
10:03
What does Long-term Holder Supply indicate near market bottoms?
The percentage of Bitcoin held by long-term holders is at its highest, meaning coins moved from weak to strong hands.
11:52
What three things happen during capitulation?
Rapid price drops, huge liquidations in derivatives, and huge spikes in selling volume.
12:45
What is dollar-cost averaging (DCA)?
Splitting capital into multiple purchases over time instead of buying all at once.
15:29
What price range do some analysts believe Bitcoin could fall to?
$50,000 to $55,000.
16:39
Sideways markets wear down investors
Explains the psychological mechanism that makes sideways phases critical for market bottoms.
02:01Bottom formation pattern
Describes the typical multi-step process of a market bottom, countering the myth of a single 'magic candle'.
03:08Opportunities appear when buying is scary
Highlights the counterintuitive nature of great investment opportunities.
06:18Long-term holder supply as a bottom indicator
Provides a concrete on-chain metric to assess market bottoms.
10:56Dollar-cost averaging strategy
Offers a practical, risk-managed approach to investing in uncertain markets.
15:29[00:01] asset, there are two options. It's either going up or it's going down. And if it goes up, it's usually because there are a lot of people buying, and that makes demand and the price go up. And if it goes down, the opposite happens: people sell and the price
[00:14] drops. But there is a third option that few people pay attention to, and it is every investor's nightmare. When the market neither goes up nor down, when it moves sideways, it is a time of chaos, of uncertainty for
[00:27] everyone, and you don't know whether to buy, sell, or keep your money under the mattress. And this is what's happening right now with Bitcoin. These sideways movements are often the forerunners of a big move
[00:41] a big fall, and we have seen this many times throughout history. So what's going to happen to Bitcoin? Should you buy now before a big rise or wait because it's still going to go down further? Well,
[00:54] nobody really knows for sure, but in this video we're going to try to find out with data because there are three indicators that tell us that Bitcoin could be about to crash again and reach even lower prices. So whether you
[01:07] already own Bitcoin or are thinking about investing in it, wait until you see this video to find out the best time to do so. Okay, there's one thing that almost no one explains well when you start investing in Bitcoin.
[01:20] Most people more or less understand what happens when the price goes up. If it goes up, there's euphoria. Everyone's talking about it. Investing seems super easy, it seems super obvious, and you also understand what happens when the price falls
[01:34] fear sets in, when people get nervous, when they start to think they've made a mistake and that many are selling. Others vow never to touch crypto again in said is much harder psychologically than a rise or a
[01:48] sharp fall. And that's when the market gets stuck in no man's land, when it neither breaks out strongly upwards nor completely collapses. That 's the side market. And although from the outside it may appear to be a boring phase,
[02:01] in reality it is usually one of the most important phases of the entire cycle. And why? Because it's precisely that phase where the market wears almost everyone down . A sideways market doesn't destroy so much because of its speed and
[02:15] volatility; it destroys because of the exhaustion it causes. It tires you mentally, makes you doubt, makes you lose conviction, makes you feel like nothing is happening and a person feels that nothing is happening, they stop paying attention, stop
[02:27] studying, stop preparing, and often, just when the market is offering the best opportunities, that person no longer has the energy or money sideways movements are so important, because they not only prepare the market for the
[02:41] next big price move, but they also emotionally cleanse the market. And in that way they expel the impatient, they expel those who enter because of FOMO, they expel those who need the constant stimulus of making
[02:55] money, and they leave inside those who, above all, understand how cycles work and how investments work. In fact, if you look at Bitcoin's history, major bottoms aren't usually built with a
[03:08] magic candle falling and that's it, right? In other words, it's not usually a movie scene where the price hits rock bottom and the next day, bam, everything takes off. It doesn't usually work that way. What usually happens is something much more uncomfortable.
[03:21] First there is a sharp drop, then there is a rebound that makes many believe that the worst is over, then the weakness returns and it falls a little more and finally that phase of apathy, laterality, boredom and
[03:34] total lack of motivation appears. And that's precisely why that's often where the real groundwork is laid, the bottom or at least a large accumulation zone. We saw it very clearly in the 2018 bear market, when Bitcoin was coming off the whole boom of
[03:48] 2017, the madness, the euphoria, the feeling that everything was going to go up millionaires. But when that cycle ended, reality set in, and in 2018 the price lost strength for months, reaching its annual low in
[04:02] months, reaching its annual low in December at around $3,200 . But the most important thing isn't just the exact number of the floor, emotional context that existed at that time, in that final stretch of 2018.
[04:16] Practically nobody wanted to know about Bitcoin, or cryptocurrencies, or completely changed. What months before was the future of money, suddenly was this is over and it's going to zero. And the attention had disappeared.
[04:30] Retail interest dried up completely, and the excitement turned into embarrassment that nobody wanted to talk about Bitcoin. And that's exactly what happens near many market bottoms; people aren't excited, they're exhausted. And then
[04:43] we see it again in 2022. Bitcoin had just reached all-time highs of had just reached all-time highs of $69,000 in November 2021 and then entered a very tough bearish phase and by mid-June 2022 it had already fallen
[04:56] to the $17,000 zone after the collapse of FTX Luna and that took it even below $16,000 later while a large part of the market considered the sector dead. And at that time the European Central Bank itself
[05:11] described that period, noting that Bitcoin had fallen from 69,000 to 17,000 in June 2022 and then fluctuated around 20,000 before falling again below 16,000 after the
[05:26] collapse of FTX. And the same thing happened again. It wasn't just a price drop, it was a drop in morale. People were burned out. People didn't talk about Bitcoin, you did you tried to avoid the conversations because many people had lost money,
[05:39] others had been scammed, and others simply didn't want to hear about the market ever again. And it's precisely at those moments, when nobody wants to look anymore, that opportunities begin to appear that later seem obvious
[05:51] Because now we all look back and say, "Damn, I wish I had invested in 20,000, I wish I had invested in 10,000." Sure, but the best purchases make them. Those purchases we made at 16,000, at 20,000,
[06:06] we made them literally with brutal fear, not knowing if it was really going to be the best purchase or if it was going to keep falling, right? It seems very obvious now, but when an opportunity is obvious to everyone, it's usually not that good anymore.
[06:18] So great opportunities often appear when buying is scary, when confusion reigns, and when the environment seems ugly enough that most people prefer to wait until things are clearer. The problem is that when it
[06:32] 's finally clear, the price is usually much higher. That's why, for me, it's so lateral movements, because they are not a useless phase, they are a filtering phase, a selection phase. The market is testing your patience, checking if you can
[06:47] think months ahead instead of reacting to every 4-hour candle and constantly updating Coin Market Cap, seeing if you invest with a plan or on impulse, and this connects directly with the current moment
[07:01] because as of March 20th, Bitcoin is trading around $70,000. But beyond the exact price, the relevant point is that we are in a phase where the market does not are neither euphoric nor in absolute panic. We are at a point
[07:15] where many people don't know if this is simply a pause before continuing to fall accumulation opportunity. And that's precisely where the analysis has the most value. Because if you understand how Bitcoin behaved at other cycle ends, you'll
[07:29] understand that the bottom doesn't usually come with absolute certainty. What it usually gives is doubt, lots and lots of doubt. So the question isn't just whether Bitcoin will go important question is the following. Are we entering a phase similar to those
[07:44] areas of the past where the market bored, wore down, and expelled most investors answer that, simply looking at the graph isn't enough. We need to look at indicators, we need to look at the context, and
[07:58] we need to look at signals that have historically helped us detect when Bitcoin starts to approach those areas where market bottoms are formed. And that's exactly what we're going to see right now , because if there's anything that can
[08:13] give you an advantage in a market like this, it 's not guessing the exact day of the bottom, it's those conditions that have historically accompanied the best indicators that make the most sense right now to detect if Bitcoin can still
[08:27] fall further and if it's really approaching that big long-term buying opportunity. Now, when we talk about market floors, there is something important to understand from the beginning. Nobody, absolutely
[08:41] nobody, can know what the exact price of Bitcoin's salary will be. Not the best investor in the world, not the best investment fund, not the best analyst, the market. It doesn't work like that. But what we can do is
[08:53] get as close as possible and observe certain signs that have historically appeared bearish cycles. These are indicators that don't tell you the exact day, okay? But they can help you detect that area where the market starts to enter
[09:06] zones where the risk is no longer so much in buying but in staying out. And have been especially useful in understanding when Bitcoin starts to approach these zones. Let's start with the first one. The first is
[09:22] of the most undervalued indicators in financial markets, and it is abstract or philosophical, I'm referring to something very concrete. How do most market participants feel at a given moment? And when
[09:36] the market is at its peak, people are euphoric. Everyone's talking about everyone's making money, and new investors are appearing every day, and it all seems easy, but near the bottom, the opposite happens.
[09:48] money, nobody says they are investing in crypto, others no longer believe in the market, they think it will go to zero, and many have simply stopped paying market sentiment indicator, the fear and grit index
[10:03] , it measures precisely that market sentiment, and you'll see that historically, Bitcoin's major bottoms have coincided with moments of extreme fear. It happened in 2018, it happened in 2020 with the crash we all know, and it happened again
[10:16] in 2022 after the collapse of FTX. At that time, the indicator showed levels of extreme fear for several weeks. And this makes a lot of sense when you think about it, because when everyone is
[10:29] convinced that the market is going to keep falling, it usually means that most of the people who wanted to sell have already sold, and when there aren't many sellers left, the market starts to lose that downward pressure. And that does
[10:41] n't mean the price will rise immediately, but it does mean that the market may be approaching an area where selling no longer makes sense for many participants. And that is one of the first signs that
[10:56] The second indicator is the behavior of long- term investors, okay? It is one of the most interesting ones that exist within on-chain analysis. It's called Longterm Holder Supply and basically measures how much
[11:11] Bitcoin is in the hands of investors who have n't moved their coins for a long time . And why is this important? Well, because historically long-term investors tend to behave very differently from
[11:23] newer, short- term investors. New investors tend to sell when the market goes down. Veteran investors usually do just the opposite. They buy when the market is depressed and sell when the
[11:37] market is euphoric. Therefore, when we analyze Bitcoin cycles, we see something super interesting: near market bottoms, the percentage of Bitcoin held by long-term holders is usually at its
[11:52] highest. And what does that mean? Well, the currencies have passed from those weak, short-term hands to strong, long-term hands, and the more emotional investors are already out and have sold. And now much of the
[12:04] supply is in the hands of people who have no intention of selling easily because they understand the underlying Bitcoin, and that greatly reduces selling pressure. And when the market is left without significant selling pressure, then
[12:16] that floor begins to form. And we saw this very clearly in 2018, also in 2022, and it is usually one of the most interesting signs of silent accumulation. Let's move on to the third indicator, and this one has to do with something that usually happens
[12:31] near the end of many bear markets: capitulation. Capitulation is the moment when the market surrenders. It is when fear reaches its peak, when many people sell simply because they can no
[12:45] longer endure the uncertainty. And at those moments, three things usually happen at the same time. The first is that we see rapid and violent drops in price. The second is that we see huge liquidations in derivatives markets, and the
[12:58] third is that we see huge spikes in selling volume. It's as if the all the investors who were holding on out of fear end up selling at the same time because they can't take it anymore. And paradoxically, that
[13:13] uncomfortable moment often marks the end of many downward trends. It happened in March 2020, it happened in June 2022, it also happened at the end of the 2018 bear market, and that does n't mean the market will immediately rise afterward, but it does usually
[13:28] mark a point where the market begins to stabilize and is that moment of capitulation and building a base for the next cycle. So when you put together these three elements of extreme sentiment,
[13:41] market capitulation, then you start to see a very interesting pattern, and it's not a magic signal, but historically it has been one of the combinations that appears very close to market bottoms. And if Bitcoin has taught us anything
[13:54] in the last 15 years, it's that the best times to buy almost never come with optimistic headlines. On the contrary, they arrive afraid. They arrive when it seems that nobody wants to hear about crypto anymore. And
[14:07] here's where the big question arises, because if Bitcoin could fall even approaching areas that have historically been very good opportunities, then what should we do now? Buy now, wait for it to drop further, or
[14:20] market? Because there is a strategy that, in my opinion, makes much more sense than trying to guess the exact floor. And that's precisely the strategy we're going to look at now. After everything we 've seen so far, we come to
[14:34] that question, the most important one in the whole video. Should we buy Bitcoin now? And the honest answer is this: yes, but with strategy. from analyzing past cycles, it's that nobody can pinpoint the exact bottom of the
[14:48] market, not the big funds, not the most famous analysts, not even investors who have been in the industry for 12 years. The bottom of a bear market is only clearly recognized once it has passed, and that's why trying to guess the
[15:01] exact point where Bitcoin will stop falling is usually a bad strategy. Because? Because if you wait for the perfect price, one of two things often happens. Either the market rebounds sooner than you expected and you miss
[15:14] out without having bought anything, or you enter too early with all your capital and the market continues to fall for months. Both situations are very common, and that's why times like these, there's a strategy that has historically worked very
[15:29] well: the dollar cost average, or what is commonly known by its acronym of trying to guess the purchases. Memento, you have €10,000 and you divide it into five purchases of €2,000 and
[15:44] you buy little by little as the price goes down or as the price imagine you have those €10,000 that I said you want to invest in Bitcoin. Instead of buying those €10,000 today, you could divide that capital into several
[15:56] parts. You buy part of it now, another part if the market falls a little more, falls even more, and so on. This way you achieve if the market rebounds on the first purchase
[16:10] Because if we start to rise sooner than we thought, we'll be out. And secondly, you can take advantage of those better prices if the market continues to purchase price. It's a much smarter way to navigate in times of
[16:25] not have that expertise because bearish, the goal is not to hit the exact minimum, the goal is to accumulate positions at increasingly attractive prices. And this is where the
[16:39] current context comes in. If Bitcoin were to fall towards the $50 to $55,000 range, as some analysts believe, we would be talking about prices that have historically been very interesting from a
[16:53] scenario doesn't happen and the market decides to turn around beforehand, a DCA would allow you to already be in the market with a portion of your capital. And that's why right question isn't, "Will I hit the floor?" The real question is,
[17:08] might seem very cheap in a few years ? Because if you look at the history of Bitcoin you will see something very curious: the people who bought in 2018 thought they were taking a huge risk, and the people who bought in 2020 thought the
[17:21] market could collapse and go to zero. People who bought the same thing in 2022, that is, they thought the sector could literally disappear. And yet, as those people and say, "Damn, they were so smart. How did they see it?"
[17:35] clear. They were very good opportunities, but we didn't see them. And this doesn't mean that Bitcoin is going to go up tomorrow, or next week, or even necessarily this year Bitcoin has demonstrated for more than a decade is that cycles of fear and
[17:50] cycles of euphoria repeat themselves time and time again . And usually the people who manage to benefit from these cycles are not those who try to hit the perfect point, but those who are patient, who understand the context, and who
[18:04] know how to take advantage of the moments when the market is confused. So going back to the question at the beginning of the video, should you buy Bitcoin in 2026? The answer, then, is not as simple as a yes or a no. But what does seem
[18:18] clear is that we are entering a phase of the cycle where prices are starting to be much more interesting than they were a few years ago, and the market may still experience further declines, we may still see moments of even more
[18:30] fear, even some collapse for some geopolitical reason. You can probably guess which one. It is precisely at these market moments that the best opportunities begin to arise . That's why, more important than predicting the future is
[18:43] having a strategy, understanding the cycles and not switching off, continuing to watch these videos and knowing how to take advantage of the phases where most people are often the markets that seem the most boring end up being the ones that
[18:57] build the greatest opportunities. So if you also want to learn how to generate this profitability in the crypto market, even when the market is falling, I recommend you watch the free 15-minute masterclass that I've
[19:10] description. In that class, we teach you the strategies we're currently using to continue generating profitability in the market, even when Bitcoin is falling. There are strategies that work
[19:23] when it's falling, and even if you're starting from scratch or have very little time each day. So it's completely free. We recorded it with you can watch it right now. So if you want to understand how to take advantage of this
[19:35] from the sidelines, go to the first description of the video, watch it, and keep learning about this sector. See you inside. A decentralized hug.


⚡ Saved you 0h 19m reading this? Transcribe any YouTube video for free — no signup needed.