
Why Market Fools You?
45sRelatable pain point of retail traders losing money, hooking viewers immediately.
▶ Play Clip"Delivers a solid SMC overview but oversells with 'secrets' framing; content is educational but not groundbreaking."
This video introduces Smart Money Concepts (SMC), a trading methodology that views market movements through the lens of institutional players like banks and hedge funds. The presenter explains core SMC principles—market structure, break of structure (BOS), change of character (CHOCH), supply and demand zones, fair value gaps (FVG), and liquidity grabs—to help retail traders shift their perception from indicators to institutional logic.
SMC is not an indicator or secret formula but a way to view the market like large players (banks, institutions, hedge funds). Retail traders rely on candles and indicators, while smart money focuses on structure.
Market structure is the first foundation of SMC. Price moves are not random; they form higher highs and higher lows in an uptrend. Traders should read trends from highs and lows, not individual candles.
BOS occurs when price breaks a previous high and closes above it in an uptrend. It signals trend continuation, not reversal. Many traders confuse BOS with change of character.
CHOCH happens when price breaks a higher low in an uptrend. It is the first sign of trend weakening, not a guarantee of reversal, but a warning that smart money is losing aggression in the current direction.
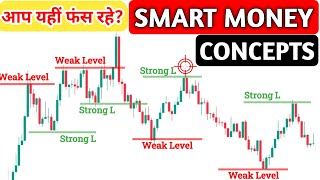
In an uptrend, a level is strong if the market made a new high from it, indicating aggressive buying by smart money. CHOCH also creates a strong level because smart money changes direction there, while retail traders panic.
Imbalance occurs when buyers or sellers are overly aggressive, visible as a large momentum candle at least twice the size of the previous candle. Demand zones are drawn from the high to low of the candle before the large bullish candle, where smart money placed orders.
Supply zones are the opposite: a large bearish candle at least twice the previous candle indicates selling imbalance. The zone is drawn from the high to low of the candle before the large bearish candle.
A powerful strategy is combining market structure with supply and demand. In an uptrend, after a BOS, a retracement that forms a strong demand zone at a strong support level is where smart money re-enters, offering high-probability trades.
A bullish FVG forms when the first candle's high and the third candle's low leave an empty space, acting as future demand. Smart money often brings price back to fill unfilled orders. Bearish FVG is the opposite, acting as supply.
The most powerful situation is when an FVG forms at a strong level, e.g., a bearish FVG after a CHOCH, indicating smart money has changed direction and is seeking selling opportunities on retracement, offering low risk and high reward.
Smart money needs large quantities of liquidity to execute trades, which is found near retail stop losses below support and above resistance. Smart money deliberately pushes price to trigger stops, generating market orders that provide liquidity.
A liquidity grab is when price briefly breaks a support level, triggers stops, but closes back above, forming a long wick. This indicates weak selling and strong buying, a classic sign of smart money entry.
SMC works only when all concepts are combined: market structure, BOS/CHOCH, strong/weak levels, supply/demand, FVG, and liquidity grabs. The goal is to shift thinking from indicators to institutional perception.
SMC is not a magic strategy but a mindset shift to view the market like institutional players. By understanding structure, imbalances, and liquidity, traders can align with smart money and improve their trading discipline.
Market Structure as Foundation
Establishes the core principle that trends are read from highs and lows, not candles, which is fundamental to SMC.
00:40BOS vs. CHOCH Distinction
Clarifies a common confusion between continuation and reversal signals, crucial for correct trade interpretation.
01:25Demand Zone Drawing
Provides a specific, actionable method for identifying where smart money placed orders, enhancing entry precision.
03:20Liquidity as the Driver
Explains the misunderstood concept of liquidity hunts, revealing why price moves against retail expectations.
06:12SMC as a Complete Framework
Emphasizes that SMC requires combining all concepts, shifting from indicator-based to institutional thinking.
08:10[00:00] चार्ट खोलते ही मैं आपसे एक सवाल पूछना चाता हूँ क्या आपने कभी नोटिस किया है कि मार्केट ज्यादा तर टाइम ऐसे मूव करती है जैसे वो हमें गलत जगह एंट्री लेने पर मजबूर कर रही हो आप support पर buy करते हो और market नीचे तूट जाती है
[00:13] resistance पर sell करते हो और market उपर उट जाती है और बाद में वही market आपके बिना ही सही direction में चल देती है यहीं से smart money concept की कहानी शुरू होती है SMC कोई indicator नहीं है, कोई secret formula नहीं है
[00:27] बलकि market को उसी नजर से देखने का तरीका है जिस नजर से बड़े players देखते हैं Banks, Institutions, Hedge Funds Retail Trader Candle देखता है Indicator देखता है लेकिन Smart Money Structure देखता है
[00:40] अब इस चार्ट को ध्यान से देखिए Price रैंडम नहीं चल रहा हर move के पीछे एक logic है SMC की सबसे पहली foundation है Market Structure Market Structure का मतलब है प्राइस कैसे high और low बना रहा है
[00:54] अगर प्राइस higher high बना रहा है और उसके बाद higher low बना रहा है तो इसका सीधा सा मतलब है market अप ट्रेंड में है यहां कोई confusion नहीं होना चाहिए लेकिन ज़्यादातर traders यही गलती करते हैं
[01:07] वो एक छोटी सी bearish candle देखकर बोल देते हैं, trend reverse हो गया. जबकि smart money trend को highs और lows से पड़ता है, candles से नहीं. अब इसी uptrend में देखिए, जब price एक previous high को तोड़ता है और उसके उपर close देता है, इसे हम कहते हैं break off structure.
[01:25] BOS का मतलब ये नहीं कि market reverse होगी बलकि इसका मतलब है trend अभी जिंदा है और smart money अभी इसी direction में काम कर रही है ये continuation का signal होता है बहुत सारे लोग break of structure और change of character में confused हो जाते हैं
[01:40] इसलिए ध्यान से समझिए break of structure हमेशा trend continuation दिखाता है अब इसी अप्ट्रेंड में अगर प्राइस एक हायर लो को तोड़ देता है यानि जहां से मार्केट ने सपोर्ट लिया था उसी लेवल को नीचे की तरफ ब्रेक कर देता है
[01:55] तब हम बोलते हैं Change of Character Change of Character पहला सिजनल होता है कि ट्रेंड कमजोर हो रहा है ये गारंटी नहीं है कि ट्रेंड पूरी तरह रिवर्स हो जाएगा लेकिन ये वार्णिंग जरूर है कि स्मार्ट मनी अब प्रीजस डारेक्शन में उतनी अग्रेशन नहीं है
[02:09] अब इस चार्ट पर जूम करके देखिए यहां आपको कुछ level दिखेंगे जहां price आसानी से तूट गया और कुछ levels दिखेंगे जहां price ने respect दिया strong weak levels concept weak level fight strong level price direction change
[02:28] uptrend में वो level strong माना जाता है जहां से market ने एक नया high बनाया. क्योंकि वही smart money ने aggressively buy किया था. अब एक बहुत important बात समझिए. change of character भी एक strong level create करता है.
[02:42] क्योंकि जब trend change होता है तो वहाँ smart money ने direction बदली होती है retail trader वहाँ panic करता है लेकिन smart money वही position build करती है अब हम आते हैं supply और demand imbalance पर
[02:55] market हमेशा balanced नहीं रहती जब buyers ज्यादा aggressive होते हैं या sellers ज्यादा aggressive होते हैं तो imbalance create होता है चार्ट पर imbalance आपको तब दिखेगा जब एक बड़ी momentum candle बनती है
[03:08] मान लीजिये एक बहुत बड़ी green candle बनती है जो पिछले candle से कम से कम दो गुना बड़ी है ये candle signal देती है कि यहां smart money ने heavy buying की है अब यहां एक common गलती होती है
[03:20] लोग उसी बड़ी candle के top पर buy कर लेते हैं लेकिन smart money कभी top पर buy नहीं करती वो retracement का wait करती है इसलिए demand zone draw किया जाता है उस बड़ी candle से पहले वाली candle के high फे लो तक
[03:33] चोकी वही से smart money ने on order feel किये थे अब चार्ट पर देखिए जब price वापस उसी demand zone में आता है और वहाँ reaction देता है, तब buying का probability high होता है.
[03:45] लेकिन सिर्फ demand zone काफी नहीं है. आपको market structure भी same direction में चाहिए. यही वज़ा है कि SMC अकेले एक concept नहीं है, बलकि puzzle है. अब supply zone समझिए, बिलकुल उल्टा logic.
[03:57] जब एक बड़ी red candle बनती है, जो पिछले candle से दो गुना बड़ी होती है, तो वहाँ selling imbalance होता है supply zone draw होता है, उस large bearish candle से, पहले वाली candle के high से low तक
[04:10] वहाँ smart money ने sell किया होता है अब यहाँ एक बहुत powerful strategy बनती है market structure plus supply demand मान लीजिए, market uptrend में है, price BOS देता है
[04:23] उसके बाद retracement आता है और उसी retracement में एक strong demand zone बनता है, वो भी strong support level पर ये वो जगह होती है जहाँ smart money दुबारा enter करती है यही वो trades होते हैं, जो दिखने में simple लगते हैं, लेकिन बहुत high probability होते है
[04:39] retail trader market market smart money discount difference retail smart money thinking fair value gap FBG smart money footprint market move price level trading
[05:11] candle उसका low break नहीं करती. फिर तीसरी candle आती है. अब पहली candle के high और तीसरी candle के low के बीच जो empty space बनता है वही bullish FBG है. ये area future में demand की तरह act करता है.
[05:26] Smart money अक्सर price को वापस उसी FBG में लाती है ताकि unfilled orders fill हो सकें. Retail trader को लगता है market reverse हो रही है. लेकिन असल में smart money incomplete business
[05:38] पूरा कर रही होती है. बेरिश FBG में exactly उल्टा होता है. एक बड़ी red candle, फिर अगली candle उसका high break नहीं करती. पहली candle के low और पीसरी candle के high के बीच का gap बेरिश FBG होता है. ये future में supply zone की तरह काम करता है.
[05:56] अब सबसे पावर्फुल सिचुएशन तब बनती है जब FBG किसी स्ट्रॉंग लेवल पर बने मान लीजिये CHOCHH के बाद एक bearish FBG बना इसका मतलब smart money ने direction change की है और अब retracement पर selling opportunity ढून रही है
[06:12] ऐसे trade में risk कम और reward ज्यादा होता है अब हम आते हैं liquidity graph पर जो SMC का सबसे misunderstood concept है smart money को बड़ी quantity trade करनी होती है
[06:24] और इतनी बड़ी quantity market में तब ही execute हो सकती है जब liquidity हो liquidity कहां होती है retail trader के stop loss के पास chart पर देखिए support के नीचे बहुत सारे stop loss होते है
[06:36] resistance के उपर बहुत सारे stop loss होते है Smart Money Price को जानबूज कर इन लेवल के थोड़ा नीचे या उपर ले जाती है ताकि Stop Loss Trigger हो जब Stop Loss hit होता है तो Market Orders जेनरेट होते हैं
[06:50] यही Liquidity Smart Money को चाहिए अब यही जगह है जहां Retail Trader बोलता है Market Fake Move दे रही है जबकि असल में वो Manipulation नहीं, Liquidity Hunt होता है price support wick liquidity grab trend reverse Candlestick important role Long wick candle price
[07:14] stops hit हुए, लेकिन close वापस ऊपर आया. इसका मतलब selling pressure weak था और buying strong थी. यह smart money entry का classic sign होता है. अब imagine कीजिए market uptrend में है.
[07:27] है, price strong support के नीचे, थोड़ी देर के लिए जाती है, liquidity grab करती है, long wick बनाती है, और वापस demand zone के उपर close देती है, यही वो जगह होती है, जहाँ professional trader buy करता है, और retail trader sell करके बाहर निकल जाता है, पूरी as aim C trading का सार यही है, retail जहां डरता है, smart money वहां काम करती है, retail confirmation ढूंदता है, smart money anticipation
[07:57] imbalance, liquidity और context पर based होती है अगर आप सिर्फ एक concept सीखोगे तो SMC काम नहीं करेगा लेकिन अगर आप market structure समझोगे BOS और CHOCH पहचानोगे strong और weak levels देखोगे
[08:10] supply demand और FBG को structure के साथ align करोगे और liquidity grab को समझोगे तब market आपको अलग नजर से दिखने लगेगी इस वीडियो का मकसद आपको कोई magic strategy देना नहीं है
[08:22] बलकि आपकी thinking shift करना है क्योंकि trading indicators से नहीं perception से बदलती है चार्ट वही रहता है फर्क सर्फ देखने वाले की आंख का होता है अगर आप यहां तक इस वीडियो के साथ बने हुए हो
[08:35] तो समझ लीजिये आप बाकी 90% traders से आगे निकल चुके हो क्योंकि ज्यादातर लोग shortcut ढूंदते हैं लेकिन आप market को समझने की कोशिश कर रहे हो अब सवाल ये नहीं है कि SMC काम करता है या नहीं
[08:49] सवाल ये है कि आप इसे discipline के साथ apply कर पाते हो या नहीं अगर आप चाहते हो कि मैं next video में इसी smart money concept पर real life chart examples के साथ exact entry, stop loss और target execution दिखाऊं, तो नीचे comment में सिर्फ SMC लिख दो.
[09:08] और हाँ, अगर ये video आपको सच में value दे रहा है, तो channel को subscribe करना मत भूलना, क्योंकि यहां हम market को noise से नहीं, logic से पढ़ते हैं. इस वीडियो को उस दोस्त के साथ जरूर शेयर करना जो अभी भी इंडिकेटर्स के जाल में फंसा हुआ है
[09:23] मिलते हैं नेक्स्ट वीडियो में जहां हम रीटेल तिंकिंग को पीछे छोड़कर स्मार्ट मनी की तरह सोचेंगे
⚡ Saved you 0h 09m reading this? Transcribe any YouTube video for free — no signup needed.