
S&P 500 vs Shanghai: A Tale of Two Markets
45sThis segment reveals a surprising historical correlation between the US and Chinese stock markets, sparking curiosity about global market dynamics.
▶ Play Clip"The title promises a market divergence analysis, which it delivers, but the prediction is speculative and lacks deep data exploration."
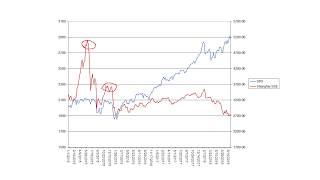
The video analyzes the price action of the S&P 500 and Shanghai SSE Composite indices from 2015 onward, highlighting their historical tendency to move in tandem. It identifies a recent true price divergence starting in March 2018, around the time of US tariff announcements, and predicts a likely convergence with a downside target for the S&P 500.
Back to January 2015, the S&P 500 and Shanghai composite have mostly moved in tandem, with brief SSE spikes in 2015 that eventually converged back.
After November 2016, both indices still moved in sync but at different rates, with SSE losing momentum relative to S&P 500, widening the spread.
A true divergence began in March 2018, coinciding with Trump's tariff talk. The S&P 500's strength suggests market confidence the US will win the trade war, which the author doubts.
The author expects the indices to converge soon. With bullish sentiment high and US valuations extreme, the most likely outcome is the S&P 500 declining to around $2,300 (or less) to catch up with the SSE, wiping out 2017–2018 gains.
True price divergence begins
Pinpoints the exact start of a historically significant market divergence tied to US trade policy.
01:14Prediction of S&P 500 decline
Offers a testable price target and rationale for a potential major market correction.
01:28[00:01] Today, we're going to take a look at the price action of the S&P 500 and the Shanghai SSC composite. This chart is based on weekly closing prices back to January 2015.
[00:15] The S&P 500 is in blue with the Chinese index in red. Apart from a couple of price spikes by the SSC in 2015, here and here, the two indices have moved more or less in tandem.
[00:31] And it's worth noting that both of those spikes eventually returned to join the S&P 500 here and here. Then in November 2016, coinciding with the U.S. presidential election here,
[00:48] the two still basically moved in sync, but at a different rate of ascent. You can see the spread between the two lines grew wider indicating that the SSE was losing momentum relative to the S 500 But what happening now is more significant than a loss of momentum It is actually a true price divergence that started occurring in March of this year coincidentally
[01:14] about the same time Trump started talking tough on tariffs. This divergent action of the S&P 500 seems to imply that investors have every confidence that the U.S. will win the trade war.
[01:28] I'm not so sure. I fully expect these two indices to converge soon. Given the extreme bullish sentiment and market valuations currently in the U.S. markets,
[01:40] I believe the most likely outcome is for the S&P 500 to decline. If it just played catch-up to the SSE, that price target would be around $2,300 or less.
[01:54] This would essentially wipe out all the gains for 2017 and 2018. Thanks for watching my video and please subscribe for future postings of stock market divergences.
⚡ Saved you 0h 02m reading this? Transcribe any YouTube video for free — no signup needed.