
The Vortex Polarity Flip Secret
45sHigh curiosity about a simple but effective reversal strategy that promises fast trades.
▶ Play Clip"The title promises a signal to find reversals, and the video delivers with a clear strategy and live examples, though it includes some filler and a promotional segment."
This video presents the Vortex Polarity Flip strategy for 1-minute binary options trading on Pocket Option, using the Vortex indicator to identify trend exhaustion and reversal points. The presenter demonstrates the strategy through live market examples, including both winning and losing trades, and emphasizes the importance of discipline and rule-following.
The video introduces a trading strategy called the Vortex Polarity Flip, which uses the Vortex indicator on 1-minute candles with 3-minute expirations. The strategy is designed to identify trend reversals by detecting when the trend is exhausted.
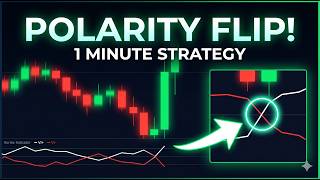
To set up the strategy, change the candle timeframe to 1 minute, add the Vortex indicator with period 14, and change the colors: VI+ to white and VI- to red. This setup is simple and requires no other modifications.
The Vortex indicator measures the distance between candle highs and lows to determine trend polarity, indicating which side (buyers or sellers) is in control. The key is not to trade on any crossover but to wait for a wide gap between the lines, which signals trend exhaustion.
The trigger for entry is the exact moment the two lines cross after a wide gap, called the polarity flip. For a sell trade, wait for the red line to cross above the white line; for a buy trade, wait for the white line to cross above the red line.
The 3-minute expiry is chosen because after a polarity flip, price typically moves in the trade's direction for at least three candles, giving the trade enough room to reach its target.
The presenter offers a free PDF guide covering the strategy, including buy/sell checklists and a quick reference entry rule card, available in the video description.
In a live market, the presenter demonstrates a sell trade: the red line sits below the white line (bulls in control), the gap widens, and when the red line crosses above the white line, he enters a sell trade with a 3-minute expiry. The trade wins as price rolls over.
The presenter advises against panicking during a trade, even if a candle looks smaller. Trust the setup, the indicator, and the expiry. Do nothing once the trade is placed.
After a pullback, the white line crosses above the red line, signaling a bullish polarity flip. The presenter enters a buy trade with a 3-minute expiry. Price pushes up, and the trade closes in profit.
In a second buy trade, the signal triggers correctly, but the market does not follow through. The trade loses. The presenter emphasizes that no strategy wins 100% of the time and that accepting losses is part of trading.
In a choppy market, the white line crosses above the red line, and the presenter enters a buy trade. Price moves up cleanly, and the trade wins, confirming the strategy's effectiveness in real-time.
The most important lesson is that you cannot control the outcome of any single trade, but you can control whether you follow your rules, wait for the right signal, and manage your risk. Consistency leads to results over time.
The Vortex Polarity Flip strategy is a simple, rule-based approach to trading reversals on 1-minute charts. It requires patience to wait for the right setup and discipline to follow the rules, accepting that losses are part of the process.
What is the period setting for the Vortex indicator in this strategy?
14
01:04
What colors are used for VI+ and VI- lines?
VI+ is white, VI- is red.
01:09
What does a wide gap between the Vortex lines indicate?
Trend exhaustion, meaning the current trend is running too hard and a snapback is likely.
01:34
What is the trigger for a sell trade in the Vortex Polarity Flip strategy?
The red line crossing above the white line.
01:46
Why is a 3-minute expiry used?
Because after a polarity flip, price usually moves in the trade's direction for at least three candles.
02:15
What should you do if a trade is not following through?
Do not panic or close early; trust the setup and let the trade breathe.
04:29
What is the key lesson about controlling outcomes?
You cannot control the outcome of any single trade, but you can control following your rules, waiting for the right signal, and managing risk.
10:29
The Secret is in the Gap
Explains that the gap between the Vortex lines indicates trend exhaustion, which is the core of the strategy.
01:34Why 3-Minute Expiry
Provides a clear rationale for the expiry time based on expected price movement.
02:15Avoid Panic
Highlights a common beginner mistake and the importance of discipline.
04:29Control What You Can
Summarizes the core philosophy of the strategy: focus on process, not outcomes.
10:29[00:01] Trading Strategies. If you've ever stared at a chart wondering is this trend actually done or is it just pausing? Today's video is made for you. personally use on Pocket Option called the Vortex Polarity Flip. One indicator,
[00:16] one specific trigger, and we're trading 1-minute candles with 3-minute expirations. So, the setups are fast, clean, and easy to spot once you know what you're looking for. Stick around till the very end because we're not just
[00:28] covering theory today. I'm jumping straight into raw, unedited live market action so you can watch this whole thing unfold in real time. Quick reminder before we dive in. Trading always involves risk and
[00:41] everything in this video is purely for educational purposes to help you understand market momentum. If you're new to this, always start on a demo account first. All right, now let's get into the charts. Let's get the chart
[00:54] ready and trust me, this is as simple as it gets. First, flip your candle time frame to 1 minute. Then, open your indicators tab and search for the Vortex indicator. Keep the period at 14. Don't touch it. Now, just change the colors.
[01:09] touch it. Now, just change the colors. VI+ goes white. VI- goes red. That's it. Setup done. So, what are we actually looking at? The Vortex indicator tracks the distance between candle highs and lows to measure
[01:22] what's called trend polarity. Basically, it tells us which side of the they're in control. But, here's the thing. We're not just jumping in on any crossover. That's
[01:34] where most people get this wrong. The real secret is in the gap. When the white and red lines are pushed far apart from each other, it means the current trend is getting exhausted. It's been running too hard, too long, and a
[01:46] snapback is coming. That's the setup we're hunting and the trigger, the exact moment those two lines cross. That's the polarity flip. That's our entry. Let me show you a sell trade. Watch how wide the gap gets between the lines. See
[02:00] that? They're stretched right to the extreme. Now, we're just waiting patiently for the red line to cross above the white line. The second that cross happens, we're in. Sell trade, 3-minute expiry, no hesitation. Why 3
[02:15] minutes? Because after a polarity flip, price usually moves in our direction for at least three candles. That gives the trade just enough room to breathe and hit our target cleanly. Before we get into the live charts, quick one. I've
[02:27] put together a free PDF guide covering everything we just went through. Buy checklist, sell checklist, and a quick reference entry rule card you can keep right beside you while you're practicing. Link is in the description
[02:39] below. Grab it, it's free. All right, now that you've got the theory locked in, let's take this to a live moving market. This is where it gets real. Watch closely. Pay attention to how wide those lines stretch before
[02:52] the cross happens. That gap is everything. Okay, so here we are on the live chart. 1-minute candles and the Vortex indicator loaded up at the bottom with our white and red lines. Now, watch the indicator carefully. Look at that
[03:05] gap. See how far apart those two lines are? The red line has been sitting way below the white line, meaning bulls have been completely in control and you can see exactly that on the candles. This market has been climbing hard, almost in
[03:18] a straight line, for a long time. But, here's the thing. No trend runs forever this far apart, it's the market screaming at you. This move is exhausted. So, what are we doing? We're not chasing, we're not jumping in early.
[03:34] for that one specific moment, the polarity flip. And right there, you see it? The red line crosses above the white line. That is our trigger. That is the exact signal we've been waiting for. No second-guessing, no hesitation. I hit
[03:49] second-guessing, no hesitation. I hit sell immediately. 3-minute expiry. Trade its job. All right, the trade is live and the clock is ticking. Look at what's happening on the chart right now. After that polarity flip, price isn't hanging
[04:02] around near the top. It's starting to roll over. Those red candles are coming in one after another and the sellers are clearly stepping in hard. Now, look down at the Vortex indicator. The red line is still sitting firmly above the white
[04:15] line. That polarity hasn't flipped back. That tells us the momentum shift is real. This isn't a fakeout. The bears have genuinely taken control of this where most beginners make their biggest mistake. They panic. They see one
[04:30] slightly smaller red candle and they start questioning everything. Should I close early? Is it going to reverse? Don't do that. You took the trade based on your rules. The indicator confirmed it. The candles are following through.
[04:43] Your job right now is to do absolutely nothing. Trust the setup. Trust the 3-minute expiry. Let the trade breathe. Watch the price. It's continuing to push down, moving cleanly away from our entry point. The polarity flip is doing
[04:57] exactly what it's supposed to do. And there it is. Trade closed and it's a winner. If you are finding value in this breakdown and you want to master more setups exactly like this one, hit that subscribe button right now and turn on
[05:10] notifications for Sam Trading Strategies. I post raw, real market trading psychology and strategy and you definitely don't want to miss what I'm dropping next week. Look at the chart. After that strong move up, price has
[05:24] been pulling back. Sellers came in hard and pushed it down significantly. But now, look at the bottom of the screen, the Vortex indicator. Watch those two lines carefully. See that? The white line is crossing above the red line.
[05:38] That is our polarity flip. But this time, it's flipping bullish. The white is telling us that buying pressure is starting to build and a potential reversal back upward could be coming. The setup is there. The gap between the
[05:52] lines is visible. The cross is happening right now. So, following our rules exactly, the same rules we always follow, I enter a buy trade immediately. 3-minute expiry. Trade order placed. This is a setup working exactly as
[06:07] designed. We spotted the exhaustion, we waited for the flip, and we pulled the trigger. Clean, disciplined, rule-based. Now, we wait. Okay, the trade is running and let's watch what happens. After our entry, look at how price behaves. It
[06:23] attempts to push upward. You can see those white bullish candles trying to form right after our entry point. For a moment, it actually looks The buying pressure appears to be showing up and the Vortex indicator at
[06:36] sitting above the red, maintaining that where the market reminds you of something critical and I want you to burn this into your memory forever. No strategy wins 100% of the time. Not this
[06:50] one, not anyone. Anyone who tells you otherwise is lying to your face. What struggling to maintain that upward momentum. The candles are not following through cleanly the way we saw on the previous sell trade. The buyers are
[07:04] trying but the sellers keep pushing back. The market is essentially in a tug-of-war right at our entry zone and that is never a comfortable feeling when your trade is live. But notice what I am not doing. I am not panicking. I am not
[07:17] closing the trade early. I am not second-guessing the setup. I took the trade based on my rules. The indicator gave the signal. The entry was valid. Whatever happens next, I accept it completely. And there it is. Trade
[07:31] closed and this one did not go our way. I'm going to be completely straight with you because that is exactly how this channel works. This was a losing trade. The market did not follow through on the polarity flip the way we needed it to.
[07:46] never gave us that clean three candle continuation. The setup triggered correctly but the market had other plans. Now, look at what is happening on this chart. The market has been moving in both directions, up, down, back up
[08:00] again. It is not a clean, smooth trend like before. It is choppy. It is volatile. And honestly, this is the kind of market that confuses most traders into making random decisions. But here is the beauty of the Vortex Polarity
[08:14] Flip. We are not trying to predict where the market goes next. We are not guessing. We are simply reading two lines on an indicator and waiting for one very specific event to occur. Look down at the Vortex indicator right now.
[08:28] Watch those two lines carefully. The red line has been riding above the white line, telling us that selling pressure has been in control of this market. But something is shifting. Look closely at the right side of the indicator. Right
[08:41] there. The white line crosses above the red line. Clean, clear, undeniable. That is our polarity flip. The power is shifting from sellers to buyers and the indicator is telling us that right at this moment. So, we follow the rules
[08:55] exactly as we always do. No hesitation, no second-guessing. Buy trade entered. 3-minute expiry. Trade order is placed and the clock starts now. The trade is Now, let's watch the market respond. And almost immediately, look at that. A
[09:11] strong white bullish candle starts forming right from our entry point. The buyers are stepping in aggressively and price is pushing upward with real momentum behind it. This is exactly the three candle continuation move we talked
[09:24] about in the theory section and you are watching it happen in real time on a live chart with a real trade running. Now, look down at the Vortex indicator again. The white line is still sitting firmly above the red line. The polarity
[09:38] has not flipped back. There is no confusion from the indicator. It is maintaining that bullish signal and backing up exactly what we are seeing on the candles above. The candles keep pushing higher. Each new candle is
[09:50] closing above the previous one. The buyers are fully in control of this market right now and everything we planned for when we entered this trade is playing out exactly the way the strategy said it would.
[10:02] 3 minutes, that is all we need. The expiry is approaching, and the trade is sitting beautifully in profit. Now, we wait for that final confirmation. Trade closed, and that is a winner. Look at that result on the screen. The trade
[10:16] closed in profit, confirmed with a green badge right there on the chart. From the moment that white line crossed above the red line, price pushed up cleanly. The buyers took full control, the candles followed through, and the 3-minute
[10:29] expiry did exactly what it was designed to do. And I want you to notice buy trade to the losing buy trade we looked at earlier in this video. The signal looks similar on both. The white line crossed above the red line on both
[10:43] setups. The entry rules were followed correctly on both, but the outcomes were different. And that is the most honest, most important lesson I can give you You cannot control the outcome of any single trade. What you can control is
[10:56] whether you follow your rules, whether you wait for the right signal, and trade is live. Do those three things consistently, and the results will take care of themselves over time. Now, we have covered a lot in this video. You
[11:10] have seen the full Vortex Polarity Flip Strategy from start to finish. You have seen a winning sell trade, a losing buy trade, and now a winning buy trade. That is real trading. That is what an honest strategy session actually looks like. If
[11:24] read the Vortex indicator and spot these polarity flip setups, then do me one small favor right now. Hit that like button. It genuinely helps this channel honest, straightforward trading education. And if you are new here, and
[11:38] you want more real, unfiltered trading content like this, subscribe to Sam Trading Strategies. I show you the wins, I show you the losses, and I teach you to think like a disciplined trader, not just a lucky one. The free PDF guide for
[11:52] this strategy is in the description below. Download it, keep it beside you and use it as your quick reference every time you sit down to trade this setup. Drop a comment below and tell me, did
[12:04] you spot the polarity flip before I entered? I read every single comment, and I would love to know what you saw on that chart. Until the next video, stay patient, stay disciplined, and I will see you in the next one.




⚡ Saved you 0h 12m reading this? Transcribe any YouTube video for free — no signup needed.